用動態圓餅圖提升你的 React 應用
使用直覺易懂的圓餅圖,以清晰且有影響力的方式視覺化資料,帶來準確且輕易理解的資料洞察。
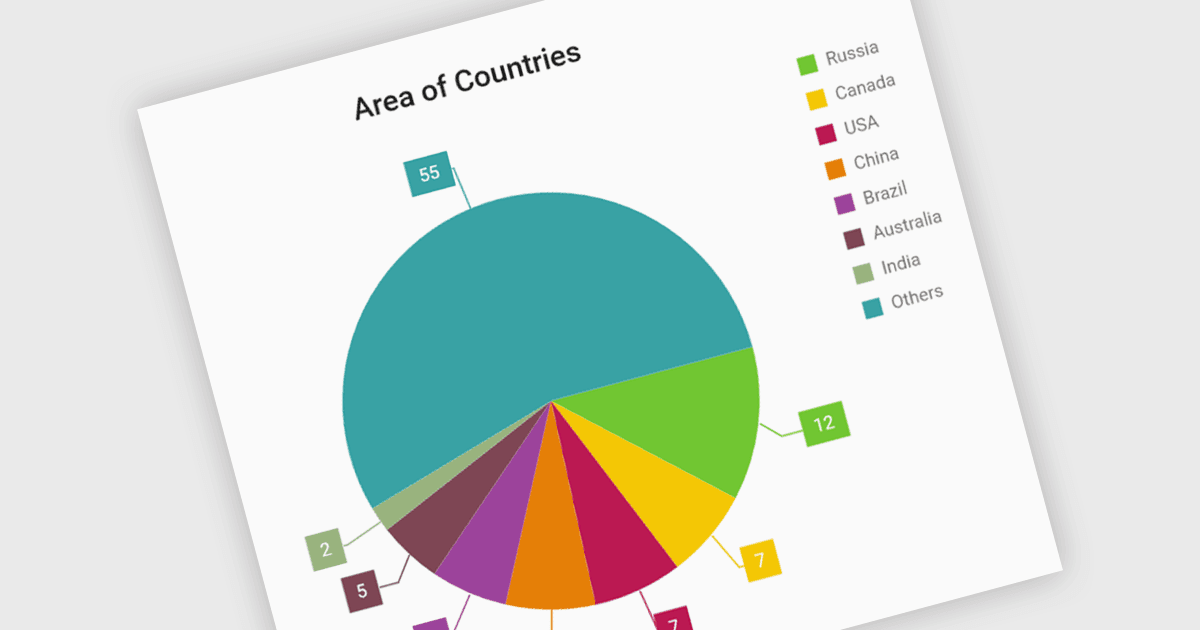
圓餅圖是圓形圖表,能以切片的形式直觀呈現資料。每個切片代表一個類別,其大小會依據其佔整體的比例來決定。圓餅圖特別適合用來說明類別型資料,例如市場佔有率、人口統計或預算分配。圓餅圖提供清晰且直覺的方式來比較相對數量,讓你能輕鬆辨識主要類別及其在整體構成中的貢獻。
多個 React 圖表控制項提供圓餅圖,包括:
- Highcharts Core(Highsoft 提供)讓你能建立可互動的圓餅圖,支援可自訂的選項,包括資料標籤、工具提示與動畫效果。
- DevExtreme Chart(DevExpress 的 DevExtreme Complete 一部分)提供具備主題與自訂選項的圓餅圖,並可與其他圖表及資料來源整合。
- KendoReact Chart(Telerik 的 KendoReact 一部分)提供具備資料繫結、動畫與事件處理的圓餅圖,讓你能輕鬆將其整合到 React 應用程式中。
- LightningChart JS 提供高效能圓餅圖,適用於複雜的資料視覺化,且能滿足大型資料集與高要求的應用情境。
若想深入了解功能與價格,請瀏覽我們的 React 圖表控制項比較。