使用多種折線表示方式比較指標
折線圖可用於視覺化與比較多個資料集,透過凸顯關聯、趨勢與對比來揭示相關性。
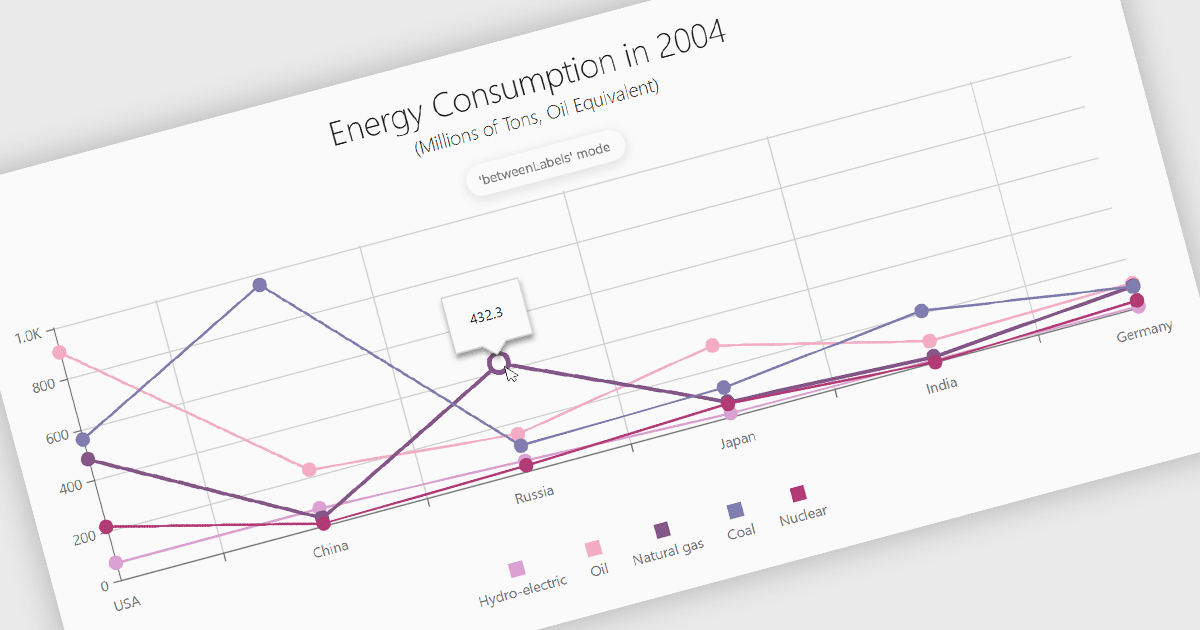
折線圖是一種基本的資料視覺化工具,用於以連接資料點的直線來表示連續區間(例如時間)的量化數值。它們特別適合用於分析趨勢、比較多個資料集,以及在大型或複雜資料集中辨識關係或模式。對軟體開發者而言,折線圖提供清晰且高效率的方式呈現動態資料,支援互動功能以進行更深入的分析,並透過可自訂且直覺的格式,讓關鍵洞見易於取得,從而提升決策品質。
以下是一些提供折線圖的 Angular 圖表控制項,包括:
- DevExtreme Chart(隸屬於 DevExpress 的 DevExtreme Complete)讓你能以響應式設計建立互動式折線圖,具備高效能,並可無縫整合。
- Kendo UI for Angular Chart (隸屬於 Telerik 的 Kendo UI)可讓你建立可自訂、功能豐富且經過最佳化的折線圖,以提升 Angular 應用程式的效能,並擁有卓越的表現。
- Ignite UI for Angular Chart (隸屬於 Infragistics 的 Ignite UI)有助於建立進階折線圖,支援具豐富互動性的即時資料視覺化。
- FusionCharts Suite XT 提供多用途的折線圖繪製能力,能呈現視覺效果引人入勝、跨平台的圖表,用於複雜資料的表徵。
如需深入了解功能與價格,請造訪我們的 Angular Charts 比較。