透過視覺化資料點揭示相關性
透過直覺的散點圖,以視覺方式探索關係、離群值與資料範圍,讓你能更清楚理解並進行有依據的分析。
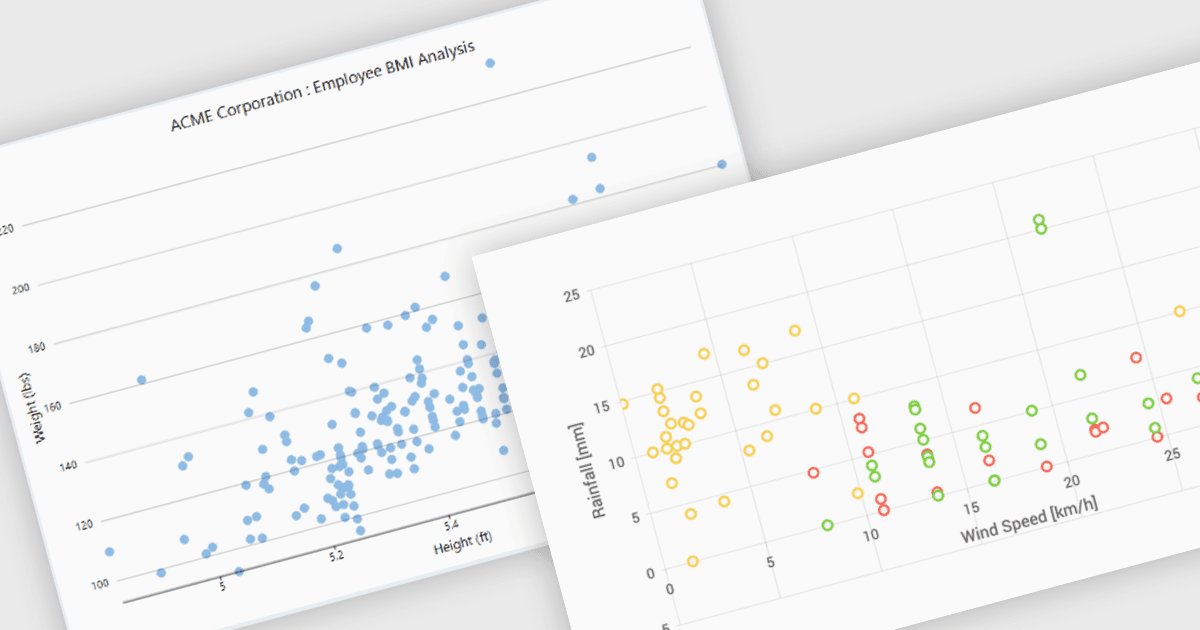
散點圖(也稱為散點圖表或散點圖)是基本的視覺化工具,透過將資料點繪製到座標平面上來探索兩個連續變數之間的關係,其中每個點的位置由這兩個變數對應的數值決定。這種視覺呈現能夠有效揭示相關性,並有助於識別離群值、群集,以及資料的整體範圍與分布。使用散點圖的好處包括:能以簡潔的方式傳達複雜的關係、能凸顯可能在表格資料中被忽略的異常,以及作為更進階統計分析(例如迴歸)的前置步驟。
多個 .NET WinForms 圖表控制項提供散點圖,包括:
- DevExpress WinForms Chart (屬於 DevExpress WinForms)透過互動式散點圖與豐富的樣式選項來視覺化相關性與分布,協助進行洞察式的資料分析。
- TeeChart WinForms 由 Steema Software 提供,讓開發人員可建立各式散點系列,支援點的自訂、趨勢線分析,以及縮放,方便進行更細緻的資料探索。
- Syncfusion WinForms Chart(屬於 Syncfusion Essential Studio Enterprise)可建立視覺效果吸引人的散點圖,並提供資料標籤、工具提示,以及多個系列等功能,用於進行比較式的關係分析。
- ProEssentials 由 GigaSoft 提供,提供高效能散點圖以揭示趨勢、群集與離群值,讓快速、即時、互動式的資料探索與具依據的分析成為可能。
如需更深入了解功能與價格,請參閱我們的 .NET WinForms 圖表控制項比較。