使用精簡迷你折線圖視覺化趨勢
網格中的迷你折線圖可透過在單元格內顯示資料趨勢,提供快速的視覺洞察,提升清晰度、比較效果與決策能力。
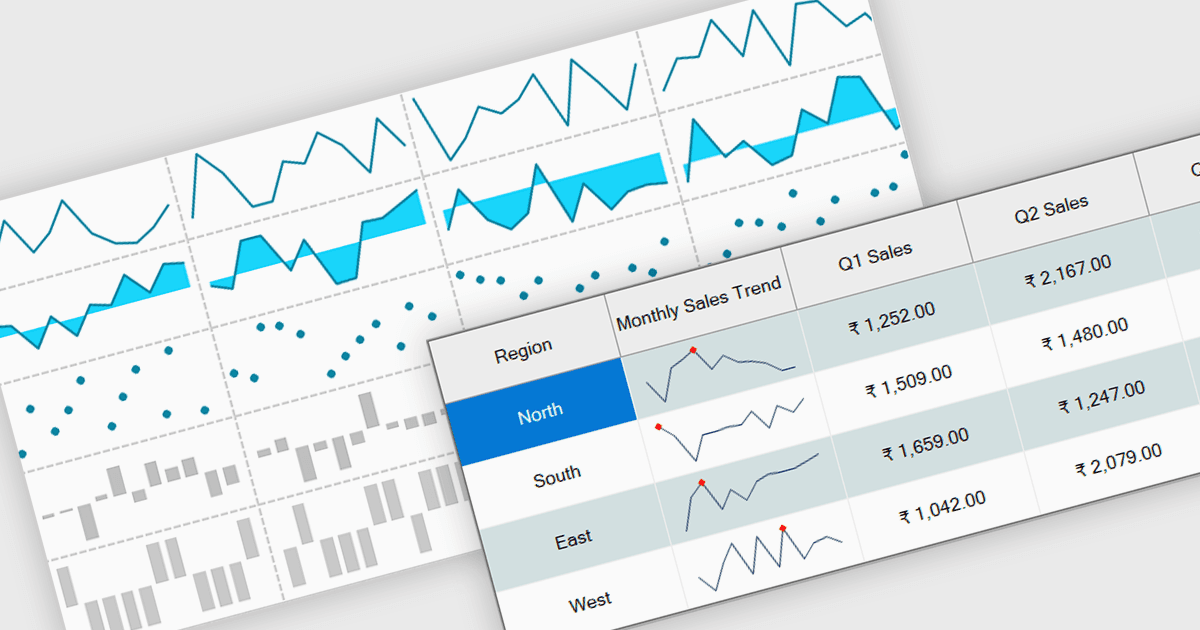
迷你折線圖(Sparklines)是嵌入式的小型圖表,會顯示在資料網格或表格的各個單元格中,提供一種精簡且直觀的方式來視覺化資料的趨勢、模式與變化。與傳統圖表不同,迷你折線圖旨在與文字或數值並排呈現,讓使用者在不占用額外空間的情況下,即時獲得視覺化的脈絡。這使它們非常適合用於對空間效率與快速理解有要求的高密度儀表板與報表。透過讓使用者一眼掃描並比較多列之間的趨勢,迷你折線圖有助於更快的決策制定與提升資料理解度。常見使用情境包括:隨時間追蹤股票表現、視覺化每月銷售趨勢、監測溫度波動,或直接在網格中比較多個頁面上的網站流量。
多個 .NET Winforms 網格控制項支援迷你折線圖,包括:
- NOV Grid for .NET 讓你可將迷你折線圖直接嵌入到網格單元格中,實現即時趨勢視覺化與精簡的資料分析。
- Infragistics WinDataGrid(Infragistics Ultimate UI for Windows Forms 的一部分)可透過迷你折線圖在列中呈現效能趨勢,提升清晰度與洞察力。
- FlexGrid for WinForms(MESCIUS 的 ComponentOne Studio WinForms 之一)透過將迷你折線圖整合到每一列中,讓使用者能立即獲得視覺脈絡,並更輕鬆理解資料。
- DevExpress WinForms Data Grid(DevExpress WinForms 的一部分)可使用迷你折線圖提供精簡的圖形摘要,讓使用者能夠輕鬆辨識模式。