用精簡的儲存格內視覺圖表偵測趨勢
透過精簡的微型圖,讓你的試算表資料洞察更清晰:呈現趨勢、突出重點,並簡化有意義的比較。
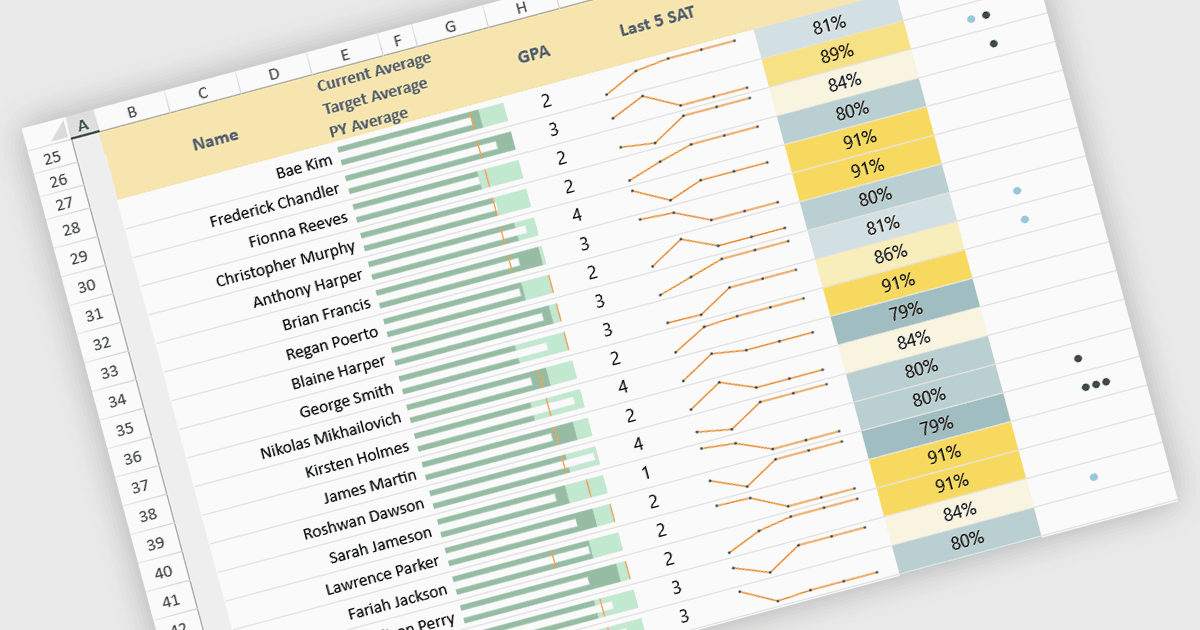
在試算表中使用的微型圖(Sparklines)是小型的、位於儲存格內的圖表,可在不需要完整尺寸圖表的情況下,提供資料趨勢的精簡視覺摘要。它們能幫助使用者快速辨識如成長、下滑與波動等模式,使複雜資訊一目了然更易理解。由於微型圖會隨著底層資料自動更新,因此能提升即時分析能力,並特別適用於儀表板、績效追蹤與財務報表。常見使用情境包括監控每月銷售表現、在同一畫面並排比較產品趨勢、在營運指標中找出異常,以及在高階主管摘要中加入清晰且節省空間的視覺情境。
多種 JavaScript 試算表控制項提供微型圖功能:
- SpreadJS 由 MESCIUS 提供,讓你可在試算表中嵌入動態微型圖,實現清楚的趨勢視覺化、即時洞察,以及精簡的資料報表呈現能力。
- Infragistics Ultimate UI for jQuery Excel Library(屬於 Infragistics Professional 的一部分)可讓你建立試算表微型圖,用以視覺化趨勢,並協助強調重點指標。
- Jspreadsheet Pro 方便在試算表中加入具響應式的微型圖,讓使用者能快速辨識趨勢、提升報表表現,並能在不同資料集之間進行直觀比較。
如需更深入了解功能與價格,請查看我們對 JavaScript 試算表控制項的比較。