透過互動式樞紐圖視覺化趨勢
JavaScript UI 套件中的樞紐圖元件,能簡化複雜的資料視覺化,提供靈活的分析能力。
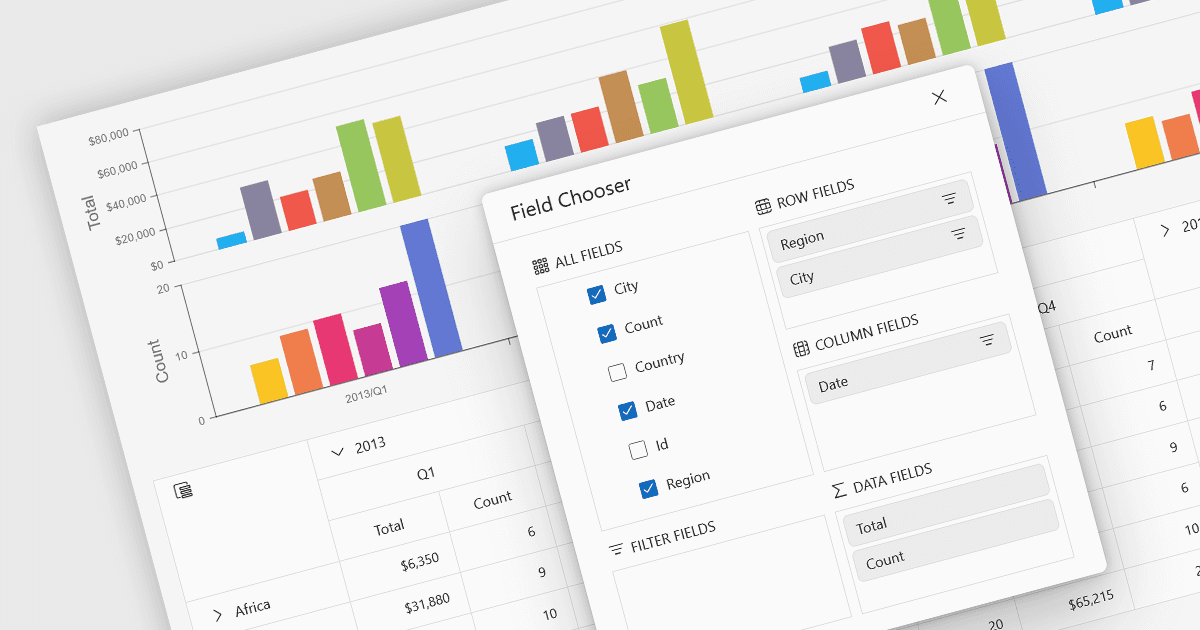
多種 JavaScript UI 套件都提供樞紐圖功能,包括:
- DevExtreme Complete 可讓你在 JavaScript 應用程式中,將樞紐式資料彙總整合到互動式圖表:由網格資料驅動視覺分析。
- Wijmo(MESCIUS 出品)可讓你綁定其 OLAP 與 PivotChart 控制項,使樞紐引擎的彙總結果輸入 FlexChart 視覺化元件,以顯示所選的彙總值。
- SmartClient(Isomorphic Software 出品)可讓你使用其圖表元件視覺化多維樞紐資料,支援動態樞紐操作與彙總圖表更新。
- Syncfusion Essential Studio Enterprise 可讓開發人員在互動式樞紐圖表中呈現彙總後的樞紐表結果,並支援多種圖表類型、鑽取(drill‑down)與自訂。
如需深入了解功能與價格,請參閱我們的 UI 套件比較。