用區間圖表清楚比較數值
透過區間面積圖表來獲得金融洞察:它會用兩個資料點之間的價值區帶進行視覺化,揭示價格範圍、預測與趨勢。
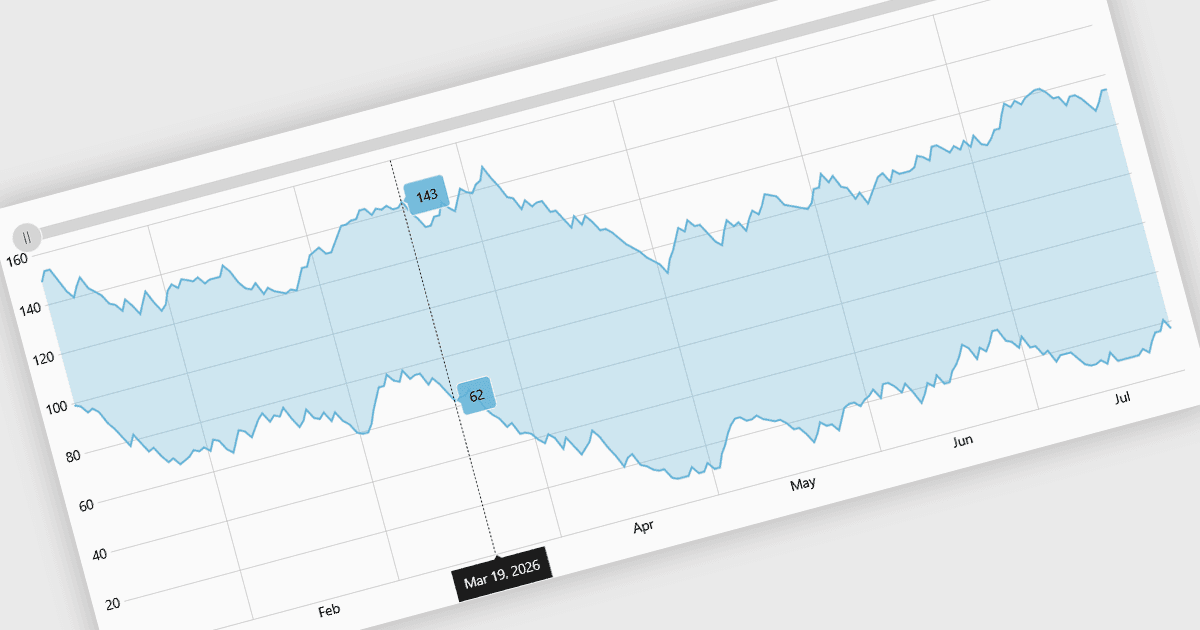
區間圖表會依據固定價格變動來視覺化金融數據,而不是根據時間間隔;透過將活動分組為一致的區間,以凸顯有意義的價格走勢。藉由過濾掉些微波動與市場噪音,它們讓趨勢、波動程度、支撐與壓力水準更容易辨識,特別是在快速變動或不規則的市場中。常見使用情境包括:交易平台的技術分析、在股票或加密貨幣中監控價格波動,以及分析高頻金融數據——在這些情況下,比起追蹤基於時間的變化,更重要的是理解真實的市場行為。
多種 React 圖表元件都提供區間圖表,包括:
- DevExtreme React Chart(Devexpress 的 DevExtreme Complete 一部分)讓你能建立強調價格走勢、以支援精準趨勢分析的金融區間圖。
- amCharts 5: Charts 方便你建立互動式區間圖表,會篩除些微波動,並以清楚的方式有效呈現底層的價格趨勢。
- AnyChart JS 讓你能為金融儀表板實作彈性的區間圖表,提升波動分析、模式辨識,以及決策的準確性與速度。
- Infragistics Ignite UI for React Chart(Infragistics Ignite UI 的一部分)可讓你在波動市場中視覺化區間圖表,揭示動能與洞察。
如需更深入了解功能與價格,請造訪我們的 React 圖表元件比較。