使用趨勢線辨識關鍵資料模式
趨勢線能揭示潛在的模式、釐清長期走勢,並將圖表資料轉化為清晰且可採取行動的洞察,協助你更快速做出決策。
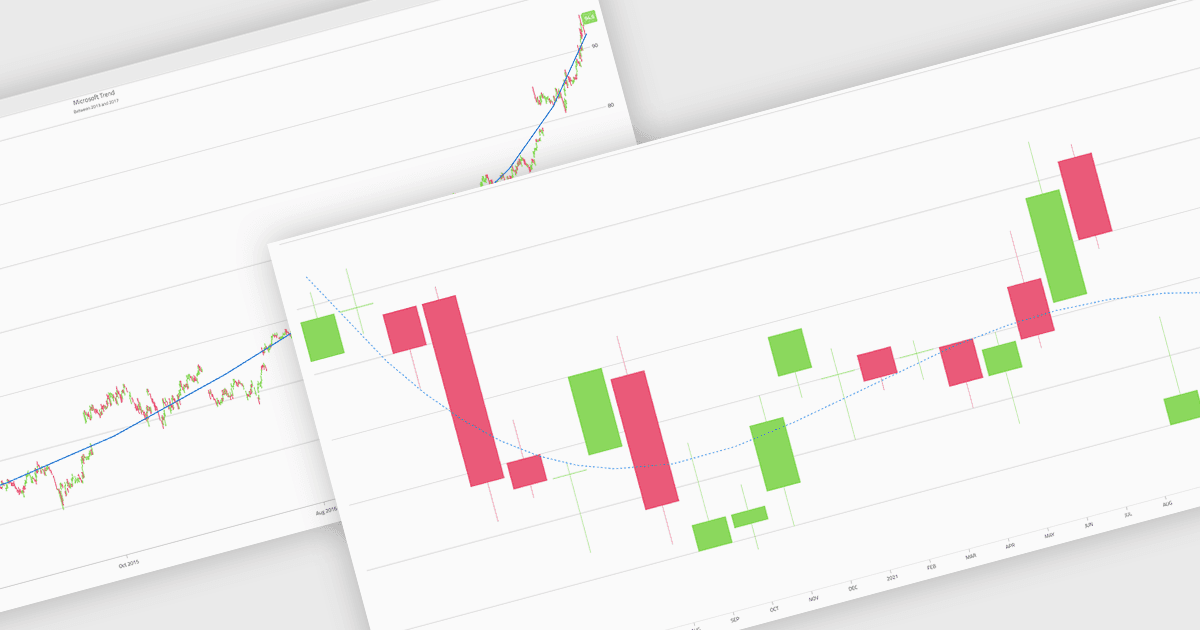
圖表中的趨勢線是分析工具,用來呈現資料在時間上的整體方向或趨勢,協助使用者解讀可能在原始資料中不易察覺的模式。透過平滑短期波動,趨勢線能釐清長期走勢、強調成長或衰退,並支援更周全的決策。他們常用於商業儀表板,用來追蹤績效指標;用於金融分析,以評估市場趨勢;也用於作業報表中,用來辨識反覆出現的模式、預測結果,並以更清晰的方式比較多組資料序列。
多個 Blazor 圖表元件提供趨勢線支援,包括:
- Telerik UI Blazor Chart(Telerik UI for Blazor 的一部分)可讓你清楚地視覺化資料趨勢,並透過可設定的趨勢線以更快獲得洞察,做出更有把握的決策。
- ComponentOne Blazor Charts(MESCIUS 的 ComponentOne Studio Blazor Edition 一部分)可讓你使用可自訂的趨勢線來分析模式,提升可讀性。
- Infragistics Ignite UI for Blazor Chart(Infragistics Ignite UI 的一部分)透過將可自訂的趨勢線疊加到支援的圖表類型上,促進趨勢發現。
- Syncfusion Blazor Charts(Syncfusion Essential Studio Enterprise 的一部分)可讓你使用自適應趨勢線來解讀複雜資料集,以凸顯整體方向。
如需更深入的功能分析與價格資訊,請前往我們的 Blazor Chart 元件比較。