將互動式地圖整合到您的報表中
將複雜資料轉化為清晰的地理視覺效果,更快揭示趨勢、簡化比較,並強化有影響力的資料敘事。
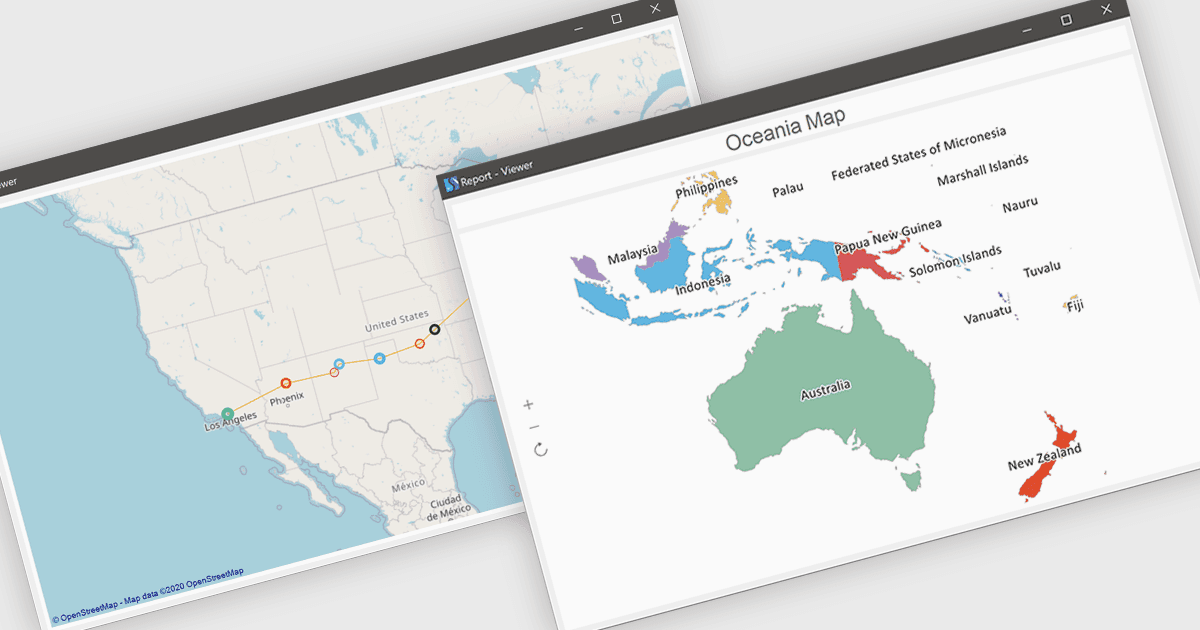
報表中的地圖可讓資料以地理方式視覺化,讓資訊能在位置脈絡中呈現,而非以傳統表格或圖表的形式。透過將複雜的資料集轉換為直覺式的地圖視覺效果,此功能能更容易辨識區域趨勢、比較不同區域的表現,並發現原本可能被忽略的模式。它以清晰且具吸引力的方式傳達洞察,增強資料敘事,同時也能支援更快速、更有依據的決策。常見的使用情境包括分析各區域的銷售表現、追蹤客戶人口統計、監控配送 物流,以及評估不同地區的市場機會。
多種 .NET 報表控制項都提供地圖功能,包括:
- ActiveReports.NET Professional by MESCIUS 可讓您在報表中嵌入地圖,將地理資料視覺化,以發掘趨勢並支援以位置為基礎的分析。
- Telerik Reporting 可協助建立以地圖為基礎的報表,幫助您有效顯示空間資料,並分析不同區域與地帶的表現。
- List & Label Enterprise Reporting Edition by combit 可讓您將地圖納入報表中,把位置資料轉化為視覺洞察,以提升理解。
- Stimulsoft Reports.NET 可讓您設計整合地圖的報表,清楚呈現區域資料,同時讓使用者探索地理洞察與比較。
如需功能與價格的深入分析,請參閱我們的 .NET 報表控制項比較。