即時視覺化地理資料
使用地圖視覺化來探索地理資料、發掘模式,並在現代應用程式與儀表板中即時監控活動。
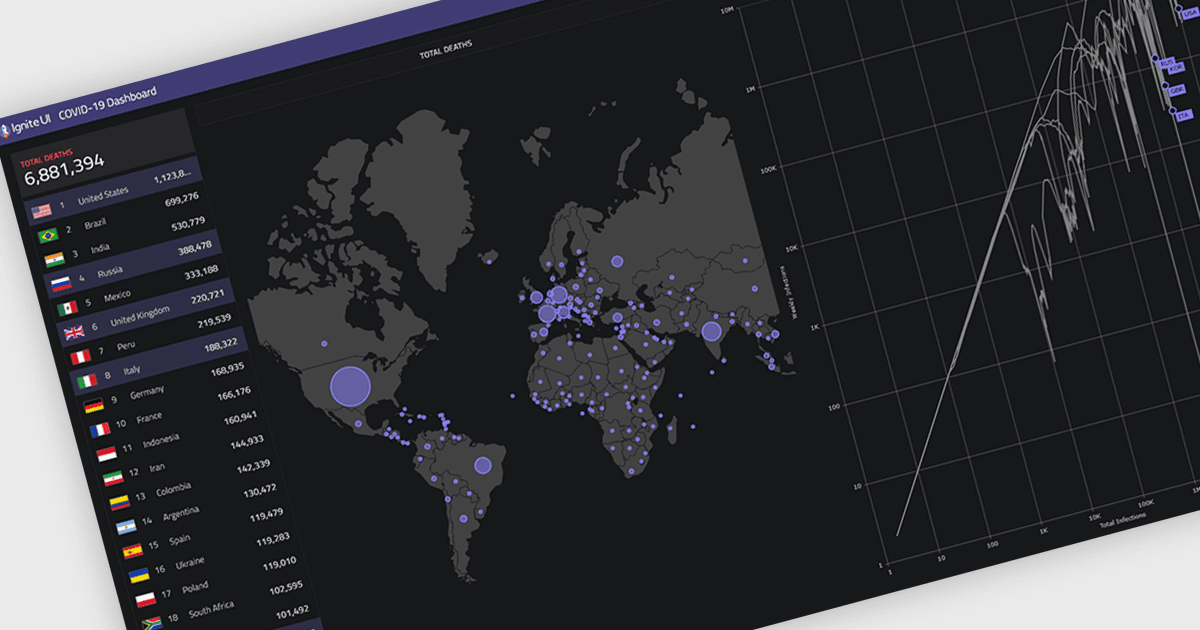
地圖元件可讓開發人員將互動式、基於位置的資料視覺化嵌入應用程式與儀表板中。透過在地理情境中呈現資料,它們能更容易辨識模式、監控活動,並支援更快速的決策。借助即時更新、資料分層與互動式導覽等功能,地圖常用於追蹤區域表現、視覺化物流與路線,以及在現代儀表板中監控即時或空間資料。
Several React UI suites provide map controls including:
- DevExpress Dxperience lets you integrate interactive maps into dashboards, enabling geographic data visualization, region-based analysis, and real-time spatial insights.
- Telerik DevCraft UI allows you to embed customizable map components, supporting geospatial data rendering, interactive navigation, and location-driven insights.
- Infragistics Ignite UI facilitates high-performance geographic mapping, enabling real-time data plotting, layered visualizations, and rich interactivity for advanced analytics.
- Syncfusion Essential Studio UI Component Suite lets you incorporate feature-rich maps, delivering scalable geospatial visualization, customizable layers, and intuitive exploration.
如需深入分析功能與價格,請造訪我們的 React 圖表控制項比較。