在 Vue.js 應用中建立互動式圓餅圖
使用帶有工具提示、圖例、標籤和動畫的響應式圓餅圖,視覺化類別比例。
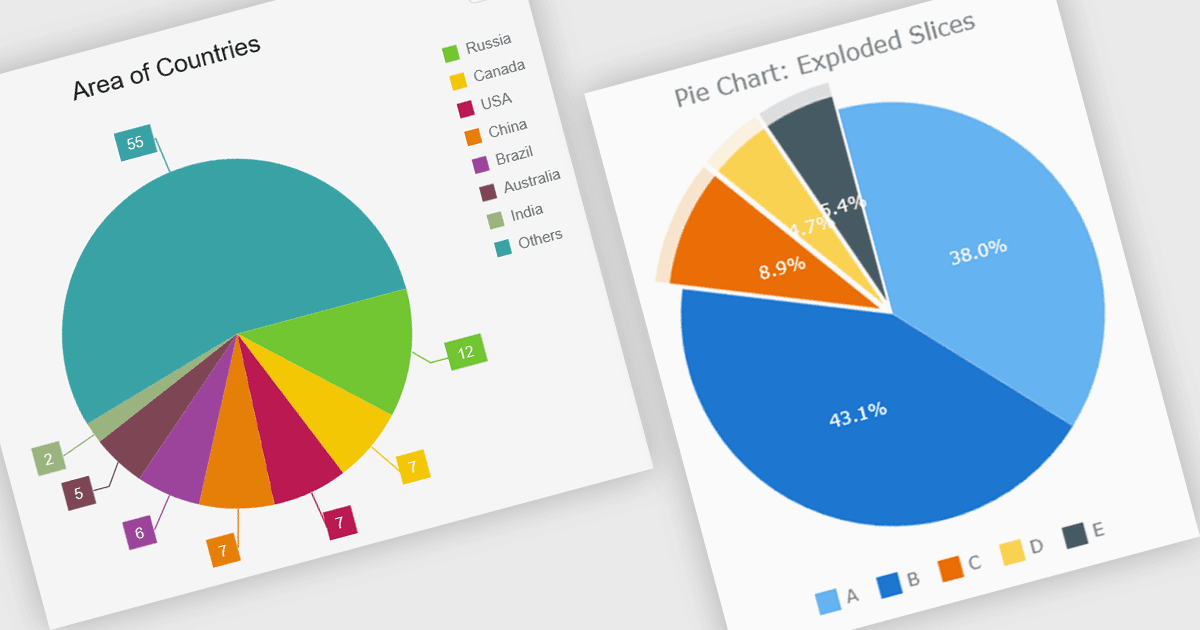
圓餅圖讓開發者能將資料以圓形的比例切片顯示,每個切片代表某個類別在總數中的份額。非常適合顯示部分與整體的關係,讓使用者能一目了然比較相對比例。設計良好的實作通常包含互動功能,如工具提示、圖例、標籤、動畫、響應式佈局和自訂選項,讓圖表能整潔地整合進現代 Web 應用中,同時提供清晰且易於理解的組成資料呈現方式。
多個 Vue.js 圖表元件支援圓餅圖,包括:
- Highcharts Core 讓您建立具有豐富自訂、響應式佈局、動畫、工具提示、圖例及彈性樣式選項的互動式圓餅圖。
- DevExtreme Vue Chart(屬於 DevExtreme Complete by DevExpress)讓您構建響應式
- 具有可自訂切片、標籤、圖例、動畫和互動工具提示的圓餅圖。
- Kendo UI Vue Charts(屬於 Telerik 的 Kendo UI)方便創建具可配置標籤、圖例、工具提示、樣式及響應式渲染的圖表。
- AnyChart JS 讓您開發具備互動工具提示、可配置標籤、分離切片、響應式佈局及豐富外觀選項的可自訂圓餅圖。
欲深入了解功能及價格,請造訪我們的 Vue.js 圖表元件比較。