使用樞紐分析圖視覺化複雜數據
建立互動式樞紐分析圖,以視覺化彙總資料、發掘趨勢,並支持有效的資料分析。
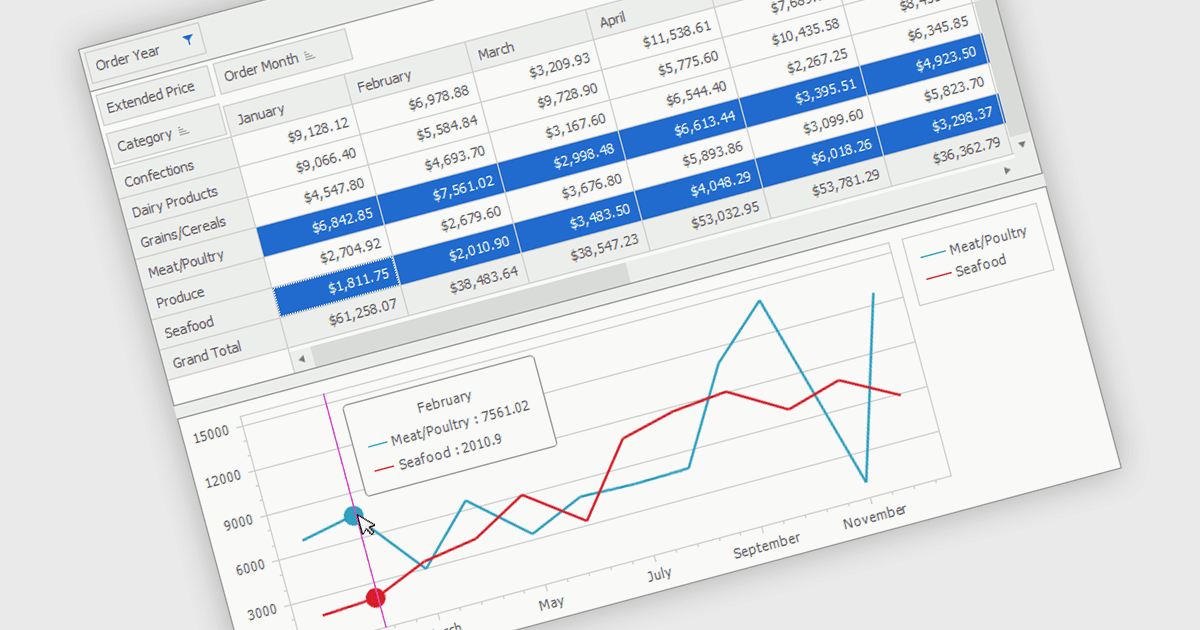
樞紐分析圖是一種互動式資料視覺化工具,搭配樞紐分析表使用,以圖形方式顯示彙總資料。它讓使用者能夠動態更改類別、系列及篩選條件來分析資料集,而不會更改原始資料。透過圖形化呈現趨勢、比較與模式,樞紐分析圖使複雜資訊更易於理解,並支持更快速的決策。它們被廣泛應用於商業智慧、報告及資料分析,特別適合需要靈活探索彙總資料的情況。
多個 .NET WinForms UI 套件提供樞紐分析圖功能,包括:
- DevExpress WinForms 允許您建立互動式樞紐分析圖,視覺化 Pivot Grid 彙總、揭示趨勢,並簡化多維度資料分析。
- MESCIUS 的 ComponentOne Studio WinForms 支援從彙總資料建立樞紐分析圖,讓趨勢分析與報告更清晰。
- Syncfusion Essential Studio UI Component Suite 實現互動式樞紐分析圖,將樞紐分析表彙總轉化為視覺化洞察,提升商業分析效率。
如需深入了解功能與價格,請造訪我們的 .NET WinForms UI 套件比較頁面。