LightningChart Python

LightningChart Python is a high performing data visualization library for the Python programming language. It allows you to present real-time or static data as fast and interactive 2D or 3D charts. Designed for data scientists and software developers, this GPU-accelerated charting library can handle large static datasets or dynamic real-time streaming data by utilizing graphics processors and WebGL rendering for the smooth visualization of up to millions of data points.

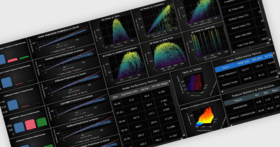
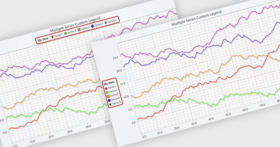
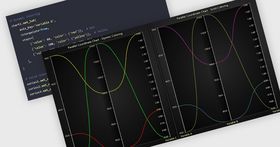
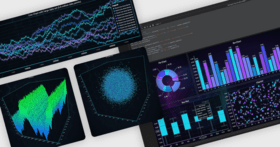
LightningChart Python Features

  • When dealing with massive static datasets or dynamic real-time streaming data, LightningChart Python can be used to turn them into fully interactive and responsive charts with smooth performance.
  • LightningChart Python achieve this by harnessing the raw processing power of graphics processors and leveraging WebGL rendering, enabling the smooth visualization of up to millions of data points.
  • The integration of LightningChart Python assists data scientists...

最新新聞

在結構化 DataGrid 中清晰視覺化指標
December 30, 2025Product Update
LightningChart Python v2.1 新添 DataGrid,可在一個完全可自訂的單一視圖中展示 KPI、衡量指標和區內視覺化趨勢。
用靈活的圖例位置優化圖表佈局
用靈活的圖例位置優化圖表佈局
October 21, 2025Product Update
LightningChart Python v2.0 添加自適應圖例定位,可控制位置,以優化可讀性並建立視覺平衡的圖表。
透過 Python 儀錶板分析多變數資料
July 22, 2025Product Update
LightningChart Python v1.2 使開發人員能夠將平行座標圖添加到儀錶板中,從而更輕鬆地分析多維資料。
用 WebGL 渲染視覺化複雜資料
用 WebGL 渲染視覺化複雜資料
February 27, 2025Product Update
LightningChart Python 為動態儀錶板、科學類比和財務分析提供 GPU 加速的即時視覺化。

價格從: $ 882.00

The Data Scientist License (Premium Edition) permits the Licensee to install and use the software during the duration of the Subscription Period only。 The subscription includes usage rights and...

有任何疑問嗎?

Live Chat現在與我們的LightningChart 專家即時聊天詢問。

LightningChart
作為官方授權的代理商,ComponentSource 可為您提供LightningChart的正版授權。
Component Type
  • Python

最近獲得的獎項

PublisherPublisherPublisher