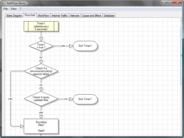
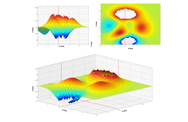
Data visualization components implement the functionality to view data in tables or data grids, as simple charts or complex graphs and enables you to create sophisticated management dashboards using gauges, maps and flowcharts.
Add interactive charts and maps to your apps and websites.
Map collection - Highcharts Maps includes a collection of maps, optimized for use with Highcharts Maps. For common maps, it saves you the trouble of finding or drawing suitable SVG or GeoJSON maps. Instead, you can choose between hundreds of pre-generated maps of countries, regions and other administration levels.
Advanced data visualization for more informative reports.
Nevron Map for SSRS - Provides report authors with an easy and powerful way to create choropleth and informative maps that are integrated with data. A perfect complement to any report that displays geographical data of any type.
Stunning JavaScript charts for your website or Web application.
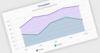
Dashboards - JSCharting allows you to quickly create business Dashboards using JavaScript and HTML5 with advanced resolution independent visuals. It has never been quicker or easier to visualize complex data in an intuitive and non-obtrusive way.
A pure JavaScript library for creating responsive, interactive charts for React apps.
Accessibility - Create interactive charts that empower people with disabilities. Users are able to navigate and interact with charts using the keyboard or voice input and they can use sonification to play back charts using sound.
Provides Visual C++ MFC developers with a professional set of modern controls.
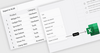
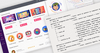
Codejock Report Control - Easily create, group and sort data in a flat or hierarchical format. Options include integrated field chooser, virtual list mode, reusable layouts, multiple selection, tree view mode and more.
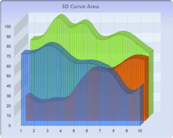
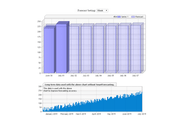
Add financial, scientific, engineering and business charts to your applications.
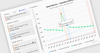
Graph Annotations - Annotations allow for mixing text and symbols in a tabular fashion within the chart or boundary of a chart. Table annotations can contain header columns and rows, hot spots, and real-time updating.
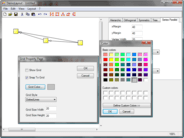
Build applications for Windows, Web, mobile and tablet.
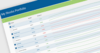
WinExplorer HTML Templates - HTML-CSS templates allow you to override the default data presentation in all view styles. Use HTML markup to specify content for WinExplorer View items and use CSS code to customize the appearance, size, padding and layout of UI elements.
JavaScript charts designed to be embedded and integrated.
Your Charts, Your Design - It is easy to adjust the look and feel of your charts using themes and palettes - AnyChart includes pre-built sets or you can create your own scheme.
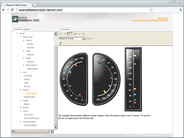
Includes over 600 UI Controls, DevExpress Dashboard, eXpressApp Framework and more.
Data Visualization Widgets - JavaScript data visualization widgets allow you to transform data to its most concise and readable visual representation. All chart, gauge and range selector widgets can be composed into beautiful, informative dashboards that effectively convey intelligence at a single glance.
Infragistics Ignite UI for Web Components includes built-in skill files which help coding assistants apply library-specific best practices and patterns.