


Official Supplier
As official and authorized distributors, we supply you with legitimate licenses directly from 200+ software publishers.
See all our Brands.
Highcharts Core (formerly Highcharts JS) is an SVG-based, multi-platform charting library that has been actively developed since 2009. It makes it easy to add interactive, mobile-optimized charts to your web pages and mobile projects. It features robust documentation, advanced responsiveness, and industry-leading accessibility support.
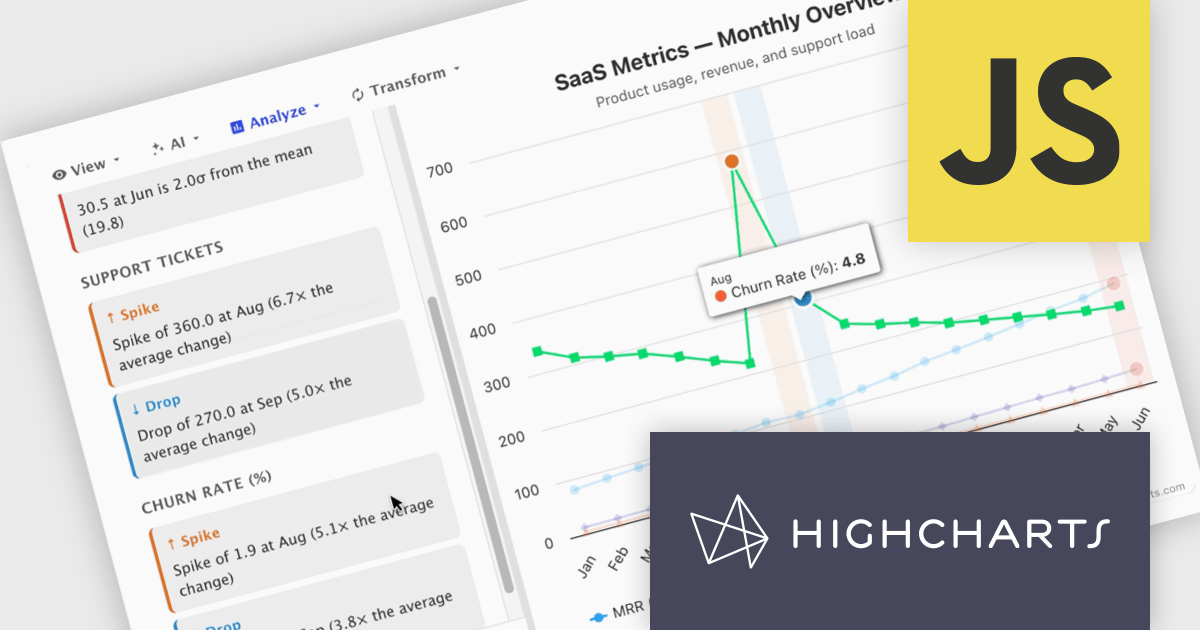
In this blog post, Highcharts' Nancy Dillon introduces you to Highcharts Orbit - A full analytics layer for any Highchart that helps you understand your data via a suite of analysis tools for forecasting, anomaly detection, and reporting. Add it to any Highcharts setup and a toolbar appears above the chart, giving you access to these powerful tools using four menus:
Read the complete blog post and download the fully-featured Preview version now!
Highcharts Core is licensed on an annual or perpetual basis, OEM licenses, and Advantage Renewals. It is licensed per Developer and has several license options including Internal, SaaS, SaaS+, and Self Hosted. See our Highcharts Core licensing page for full details.
Learn more on our Highcharts Core product page.


Tel: (888) 850 9911
Fax: +1 770 250 6199


