


Official Supplier
As official and authorized distributors, we supply you with legitimate licenses directly from 200+ software publishers.
See all our Brands.
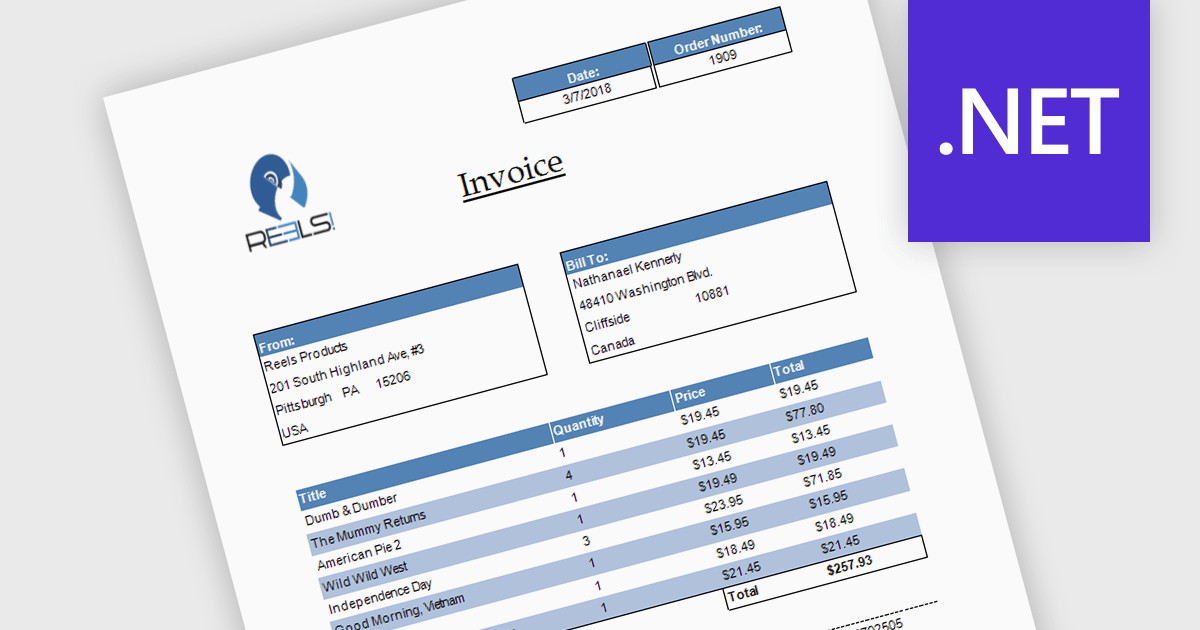
Subreports allow you to embed one report within another, making it easy to display related or detailed information alongside primary report data. By organizing complex reports into reusable sections, subreports improve clarity, simplify maintenance, and reduce development effort. They also support hierarchical data and multiple data sources, making them ideal for invoices with line items, customer reports with purchase histories, and sales reports with detailed transaction data.
Several .NET reporting controls offer support for subreports including:
For an in-depth analysis of features and price, visit our .NET reporting controls comparison.
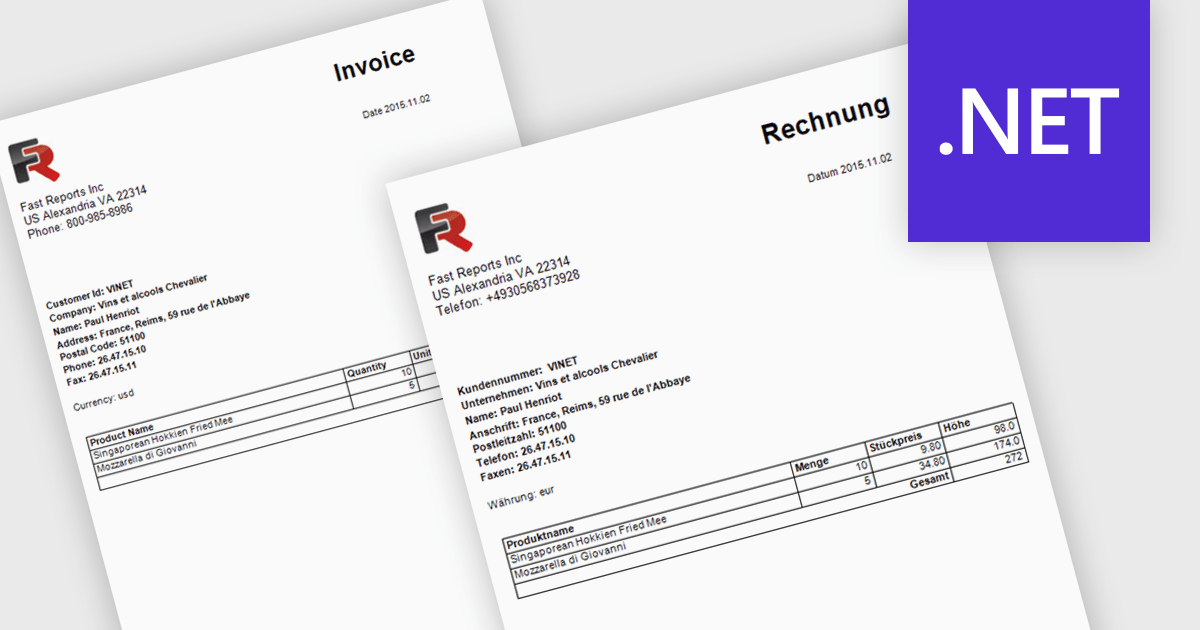
Report localization is the process of translating and adapting reports into different languages so organizations can share data and insights with global audiences. By presenting reports in a user's preferred language, organizations can improve accessibility, increase understanding, and reduce the risk of misinterpreting important information. This helps teams, customers, and stakeholders make more informed decisions while maintaining a consistent reporting experience across regions. Common use cases include localized sales reports for regional teams, analytics dashboards for international customers, and financial or compliance reports that need to be available in multiple languages.
Several .NET reporting controls offer localization including:
For an in-depth analysis of features and price, visit our .NET reporting controls comparison.
DevExpress Universal is a comprehensive suite of UI components and developer tools that supports the creation of feature-rich applications across web, desktop, and mobile platforms, including .NET, JavaScript, Blazor, ASP.NET, WinForms, WPF, and MAUI. It focuses on delivering consistent user interfaces, advanced data visualization, reporting, dashboards, and productivity features that help teams design, build, and maintain complex applications using a unified set of technologies and patterns.
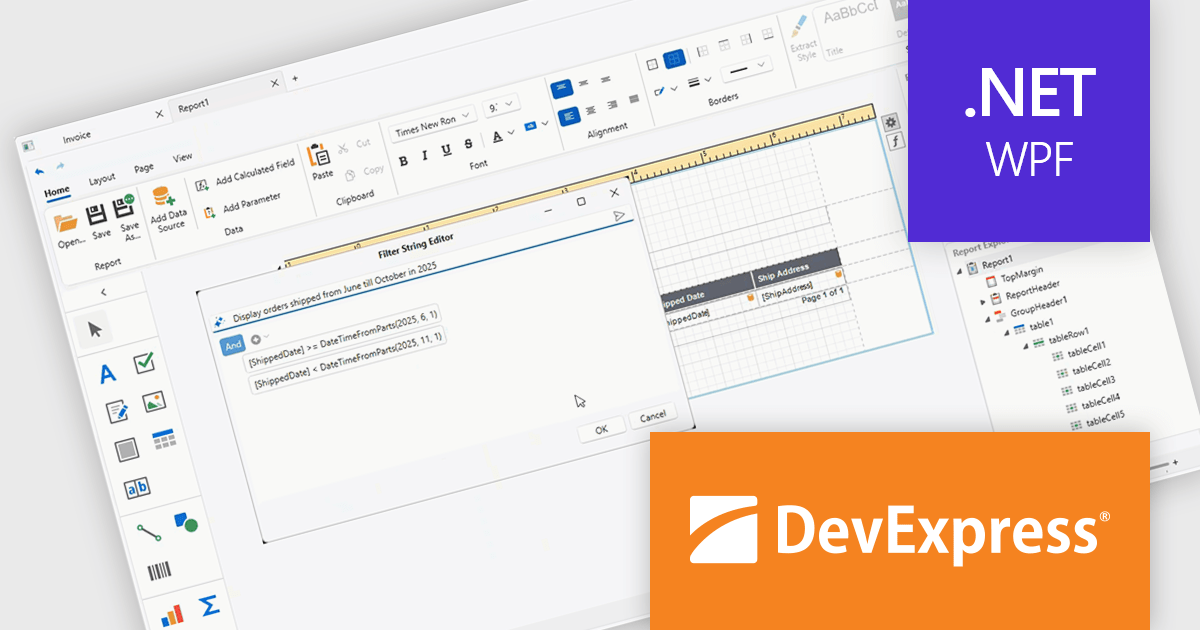
DevExpress Universal 26.1 improves the WPF Report Designer with AI-assisted expression generation within both the Expression Editor and Filter String Editor. Instead of manually writing complex Criteria Language expressions, users can simply describe the required business logic in natural language and have the expression generated automatically. This capability helps reduce the learning curve for advanced reporting features, accelerates report creation, and makes it easier for developers and business users alike to build filters, calculated fields, and other expression-based functionality with greater confidence and accuracy.
DevExpress Universal is licensed per developer and is available as a Perpetual License with a 12 month support and maintenance subscription. See our DevExpress Universal licensing page for full details.
For more information, visit our DevExpress Universal product page.
FastReport .NET Ultimate is a comprehensive reporting solution for developers working within the Microsoft .NET ecosystem. It supports the creation, design, and delivery of rich, interactive reports across Windows Forms, ASP.NET, MVC, and .NET Core applications. The Ultimate edition includes server deployment capabilities and extensive export options, such as PDF, Excel, Word, and HTML. It connects to various data sources, including SQL databases and business objects, providing flexibility for enterprise-level reporting. With the integrated FastReport Online Designer, users can edit reports directly in their browsers, enabling efficient collaboration and modern, full-featured report design across both desktop and web platforms.
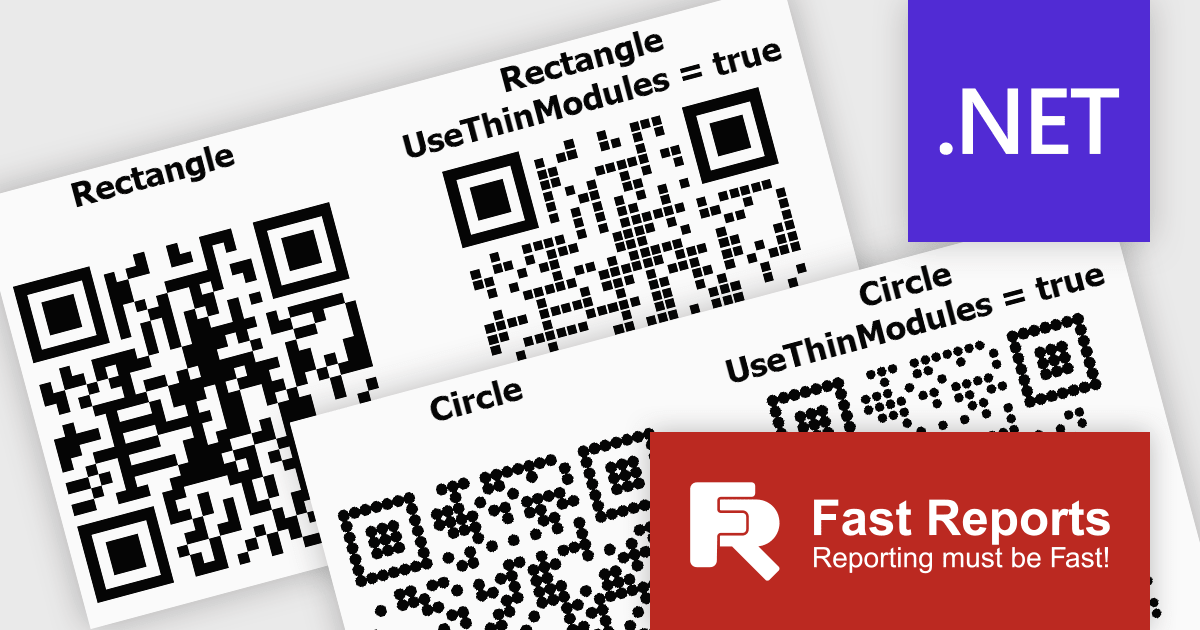
FastReport .NET Ultimate offers developers flexibility when generating QR codes, making it easier to adapt their appearance to different applications, reports, and branding requirements. By supporting a wider range of visual styles directly within the reporting engine, it enables teams to create QR codes that integrate more naturally into user interfaces, printed documents, dashboards, and customer facing materials. This helps produce more polished and professional output while maintaining compatibility, readability, and reliable scanning across standard QR code readers and devices.
FastReport .NET Ultimate is licensed per named user and is available as a perpetual license with a one-year subscription for updates and support. See our FastReport .NET Ultimate licensing page for full details.
For more information, visit our FastReport .NET Ultimate product page.
Data filtering and grouping in reporting enables developers to create reports that organize and display data based on user defined criteria, making complex datasets more accessible and actionable. Filtering allows users to focus on the most relevant records, while grouping structures data into meaningful categories that reveal trends, patterns, and relationships. Together, these capabilities improve report clarity, reduce the time required to analyze information, support more informed decision making, and provide a more flexible and efficient reporting experience for both technical and business users.
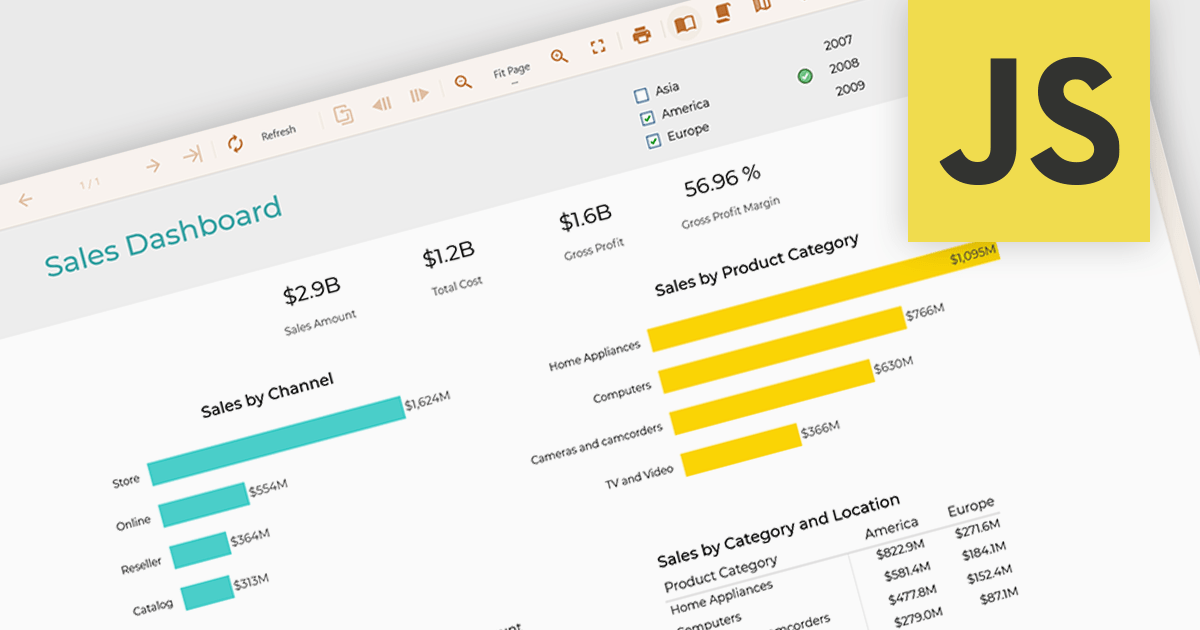
Several JavaScript reporting controls offer data filtering and grouping including:
For an in-depth analysis of features and price, visit our comparison of JavaScript Reporting Controls.


Tel: (888) 850 9911
Fax: +1 770 250 6199


