


Official Supplier
As official and authorized distributors, we supply you with legitimate licenses directly from 200+ software publishers.
See all our Brands.
LightningChart JS is a high-performance JavaScript charting library that utilizes WebGL rendering and GPU acceleration to deliver exceptional performance for a wide range of data visualization needs. It is designed to handle large datasets and complex visualizations with ease, enabling developers to create interactive and visually appealing 2D and 3D charts. Ideal for applications demanding smooth real-time data updates, such as financial platforms, engineering tools, scientific research dashboards, and industrial monitoring systems, LightningChart JS provides a comprehensive API for customization and integration into web-based projects.
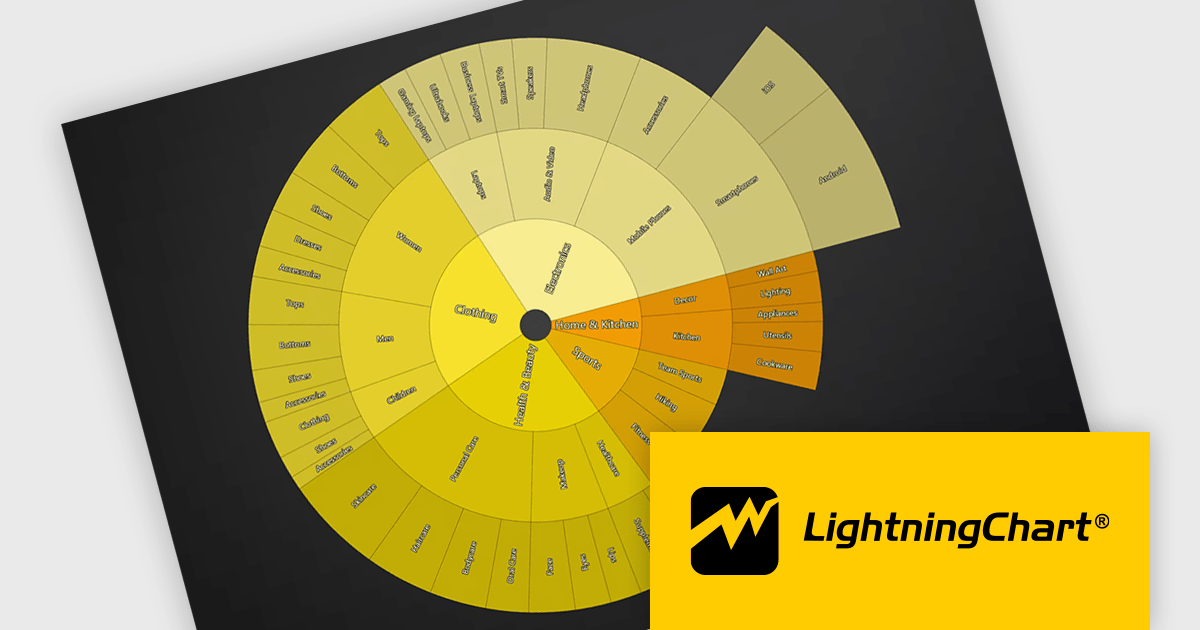
The LightningChart JS v8.3 update introduces Sunburst charts, enabling developers to visualize hierarchical data in a compact and intuitive format that clearly represents part to whole relationships across multiple levels. By displaying nested categories as proportionally sized segments within concentric rings, the chart makes it easier to analyze complex data structures, compare contributions at different hierarchy levels, and identify patterns or dominant categories without requiring multiple visualizations. This helps developers deliver more informative data exploration experiences in applications that rely on organizational, financial, operational, or other structured datasets.
To see a full list of what's new in v8.3, see our release notes.
LightningChart JS is licensed per developer and is available as an annual license with 1 year support. See our LightningChart JS licensing page for full details.
For more information, see our LightningChart JS product page.
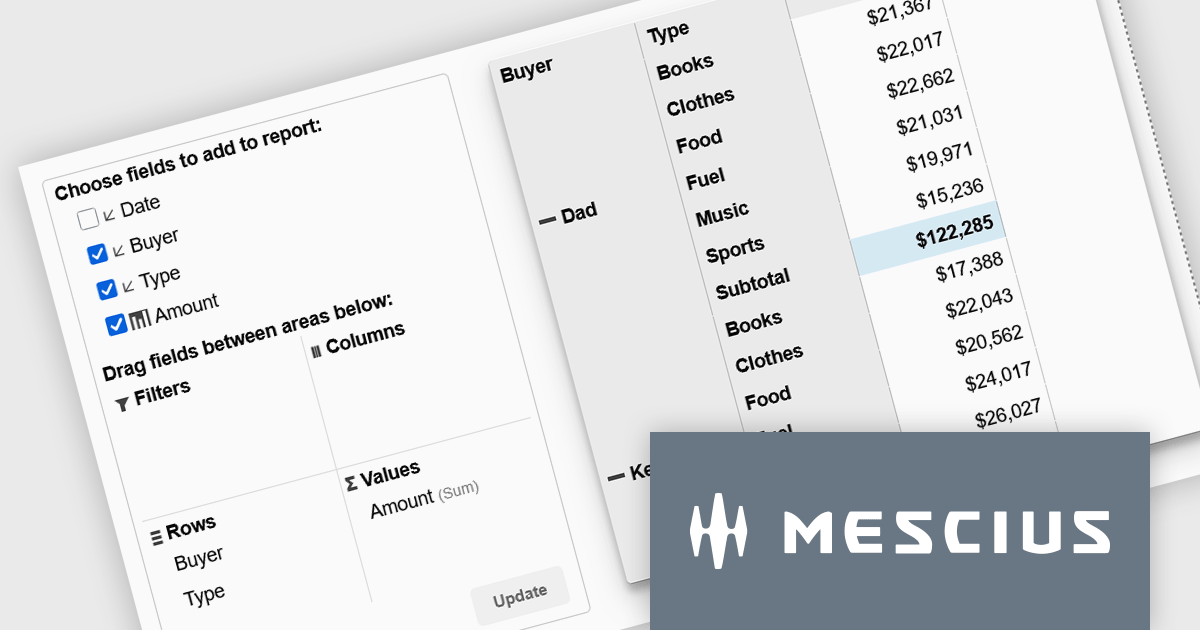
Wijmo is a cutting-edge collection of over 100 high-performance JavaScript UI controls designed for modern enterprise applications. It empowers developers to deliver superior user experiences with fully responsive, touch-friendly, and accessible components and works with any popular JavaScript framework - including Angular, React, Vue, Svelte, or pure JavaScript/TypeScript - for rapid application development across modern web and mobile platforms.
On Wednesday, July 8th at 11:00 AM EST, MESCIUS is presenting a CodeClinic Live Webinar demonstrating how to create executive-ready dashboards without requiring you to build complex aggregation logic from scratch. Joel Parks, Wijmo Product Manager for MESCIUS, will demonstrate how PivotGrid and PivotChart work together to deliver a seamless analytics experience. Key takeaways include:
Register for the Live Webinar today and mark your calendar for July 8th.
Wijmo is licensed per developer. Developer Licenses are perpetual and include 1 year Subscription which provides upgrades, including bug fixes and new features. See our Wijmo licensing page for full details.
Learn more on our Wijmo product page.
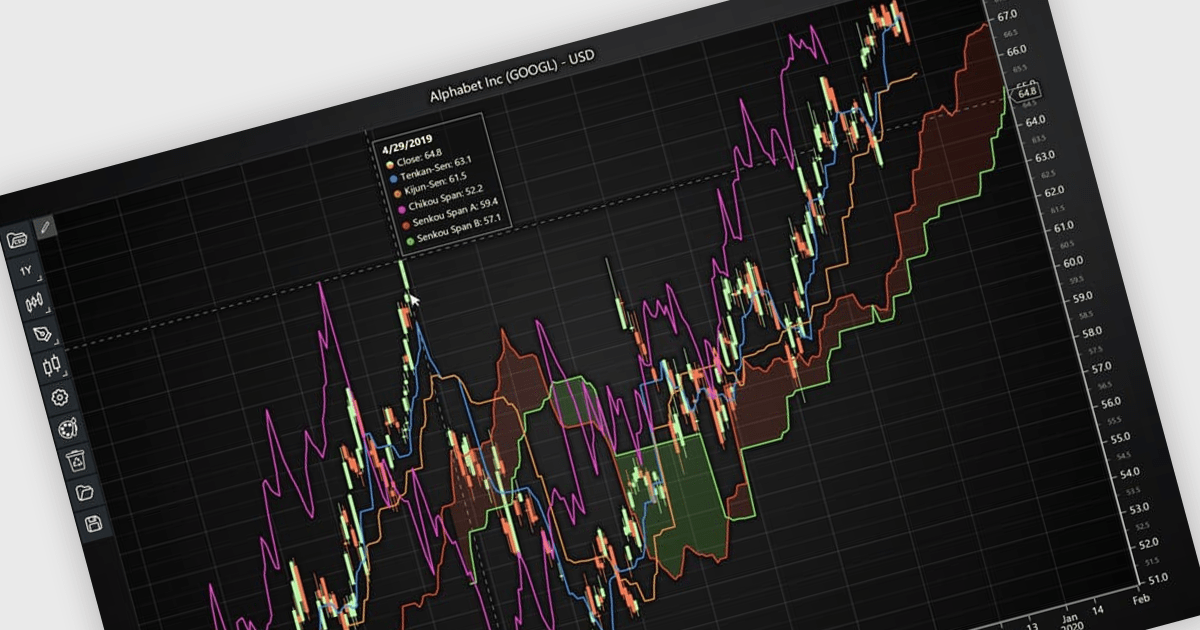
Chart indicators are tools that display calculated data on a chart to help users identify trends, measure momentum, recognize support and resistance levels, and spot potential reversals. By presenting complex market data as clear visual signals, they simplify analysis, support faster decision making, and help users uncover opportunities. Common use cases include tracking trend strength, confirming entry and exit points, and identifying key price levels where market direction may change.
Several JavaScript charting components provide support for indicators within financial charts, including:
For an in-depth analysis of features and price, visit our JavaScript chart components comparison.
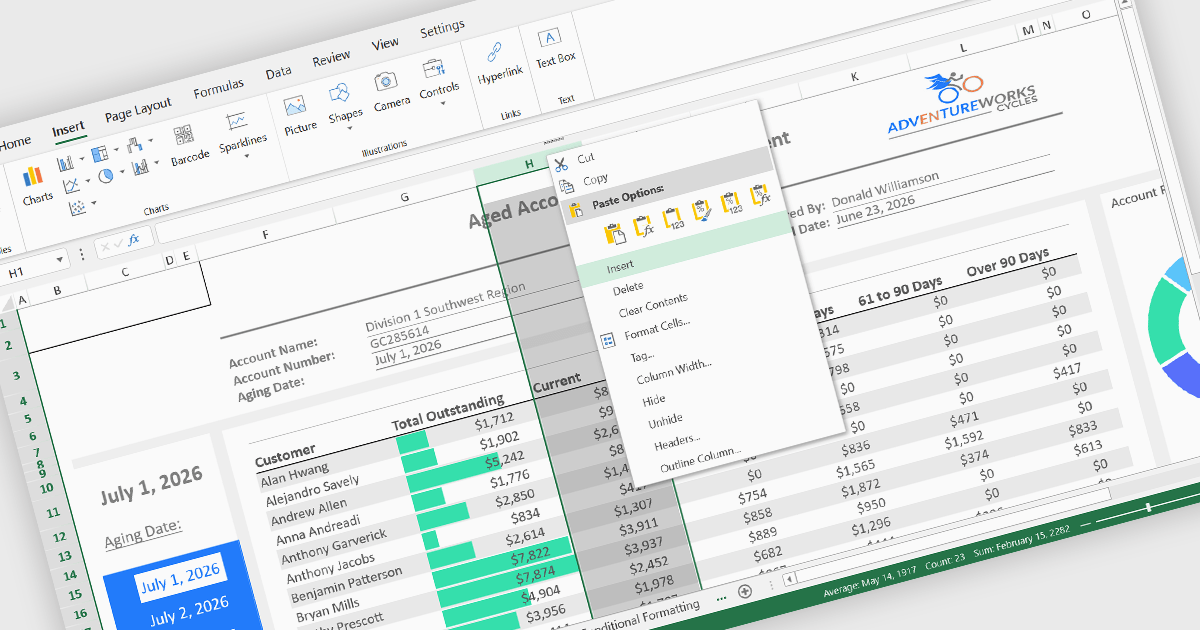
Inserting columns is a fundamental spreadsheet capability that allows users to add new columns at any position within a worksheet without disrupting existing data. This feature helps accommodate changing requirements, making it easier to expand datasets, introduce new calculations, capture additional information, and reorganize content while maintaining the overall structure of the spreadsheet.
Several React spreadsheet controls offer the ability to insert columns, including:
For an in-depth analysis of features and price, visit our React spreadsheet controls comparison.
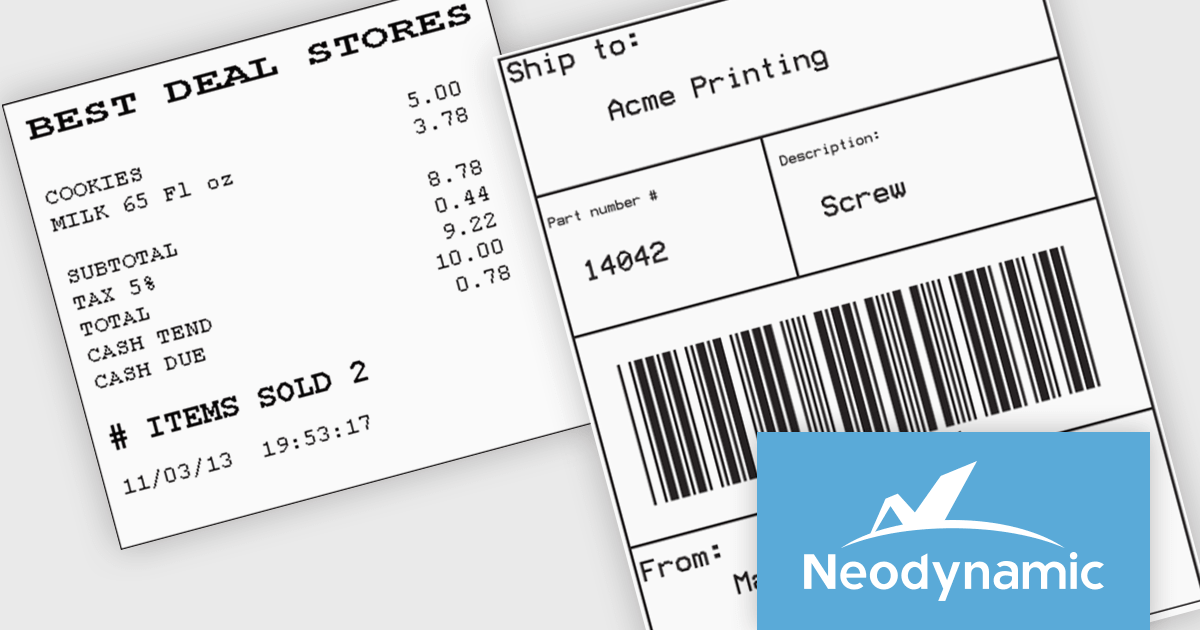
Neodynamic offers two JSPrintManager solutions for client-side printing and scanning in web applications. JSPrintManager for Any Web Platform allows you to integrate printing functionality into any website built with technologies like ASP.NET, PHP, or Blazor using pure JavaScript. Neodynamic also offers JSPrintManager for Blazor which enables you to seamlessly add printing capabilities to your Blazor server or WebAssembly projects with C# code. Both solutions empower you to print various data formats directly from the browser without requiring user interaction with print dialogs.
JSPrintManager is well suited to retail and shipping applications where fast, accurate printing is a critical part of daily operations. Developers can print receipts, invoices, packing slips and shipping labels directly to compatible printers using native command languages, helping to ensure consistent output and optimal performance. Support for carrier-generated labels from UPS, FedEx, USPS and DHL makes it easy to integrate fulfillment and logistics workflows, while compatibility with a wide range of receipt and label printers provides the flexibility needed for point-of-sale, warehouse and distribution environments.
Neodynamic JSPrintManager is licensed per Web App and Web server and is available as a Perpetual license which includes 1 year of free updates and priority support. See our Neodynamic JSPrintManager for Any Web Platform and Neodynamic JSPrintManager for Blazor licensing pages for full details.
Learn more on our Neodynamic JSPrintManager for Any Web Platform and Neodynamic JSPrintManager for Blazor product pages.


Tel: (888) 850 9911
Fax: +1 770 250 6199


