








Official Supplier
As official and authorized distributors, we supply you with legitimate licenses directly from 200+ software publishers.
See all our Brands.
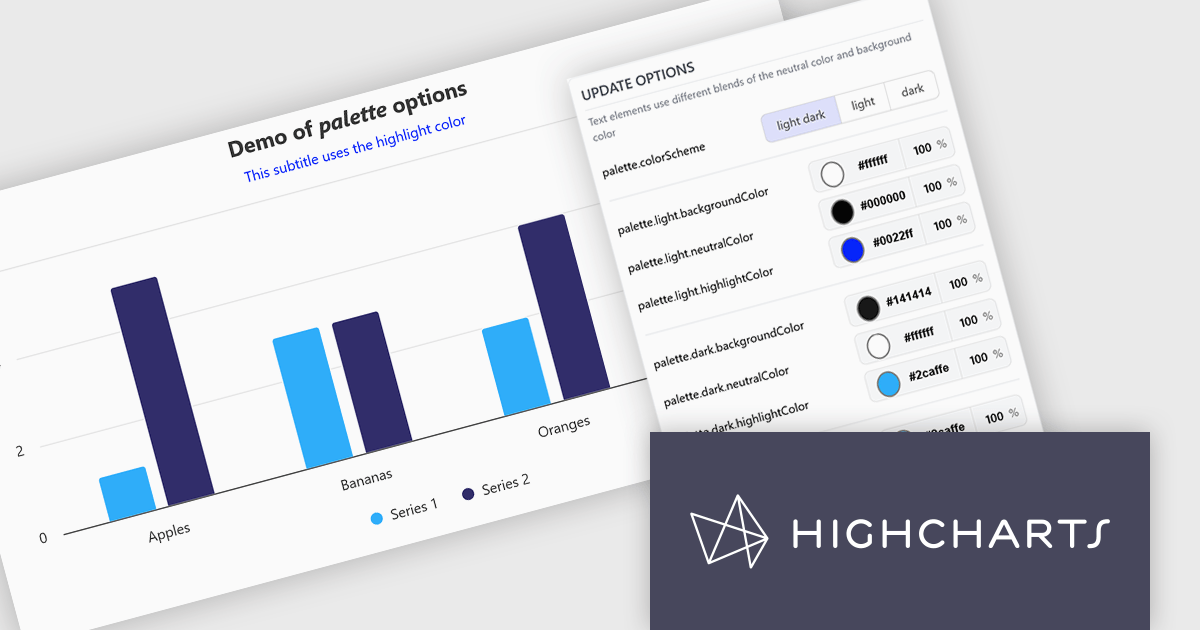
Highcharts is a JavaScript charting framework that allows web developers and data analysts to generate dynamic, visually appealing charts and graphs for websites and web applications. It can display a variety of chart types, including line, spline, area, column, bar, pie, scatter, and many more. Highcharts is well-known for its ease of use, rich documentation, and ability to handle huge datasets efficiently. Features include responsive design, accessibility support, and cross-browser compatibility. Its customization capabilities allow users to create bespoke data visualizations that increase engagement and provide insightful data presentations.
The Highcharts v13 update introduces a centralized color palette system that enables developers to define and manage chart colors, light and dark mode variations, and UI styling from a single configuration. By consolidating color settings across series, chart elements, and interactive states, it reduces repetitive configuration, simplifies brand consistency, and makes large chart collections easier to maintain. The addition of color scheme support and CSS variable exposure also allows charts to adapt more seamlessly to application themes and user preferences while providing greater flexibility for custom styling.
To see a full list of what's new in v13, see our release notes.
Highcharts Core is licensed on an annual or perpetual basis, OEM licenses, and Advantage Renewals. It is licensed per Developer and has several license options including Internal, SaaS, and Self Hosted. See our Highcharts Core licensing page for full details.
Learn more on our Highcharts Core product page.
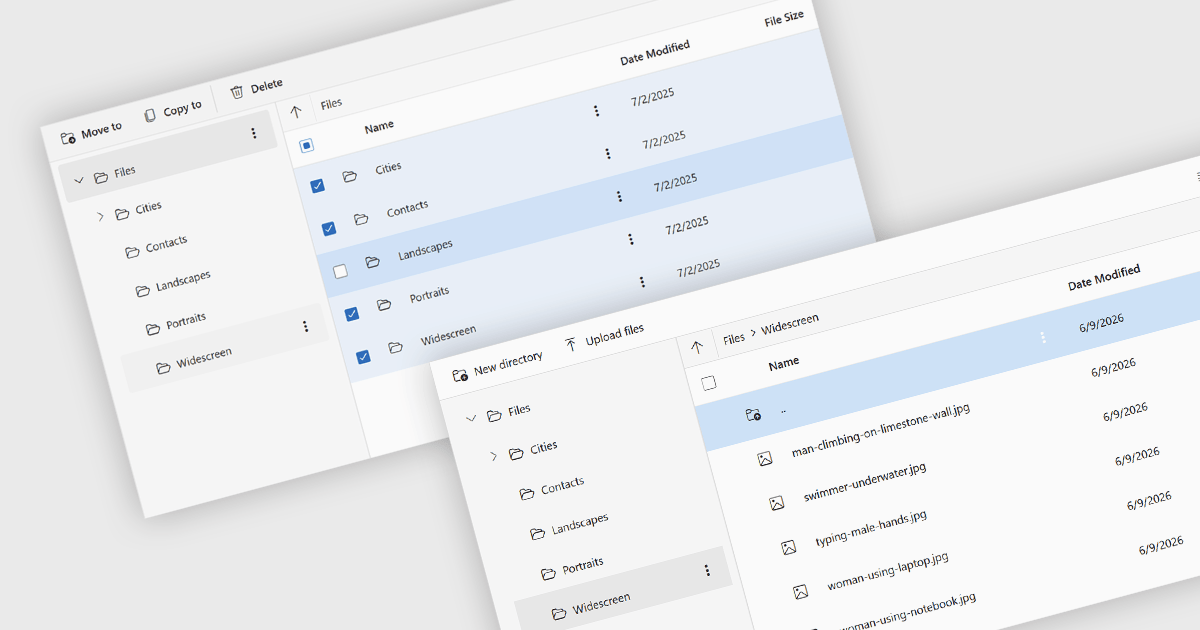
File management and shell components provide developers with tools for working with files, folders, and operating system resources within their applications. These components can provide capabilities such as file browsing, file operations, document handling, and integration with operating system features including file dialogs, shortcuts, shell metadata, and special folders. By providing pre-built functionality for these tasks, file management and shell components can reduce implementation effort and help deliver a familiar user experience.
Several JavaScript UI suites provide you with file management components, including:
For an in-depth analysis of features and price, visit our comparison of JavaScript UI suites.
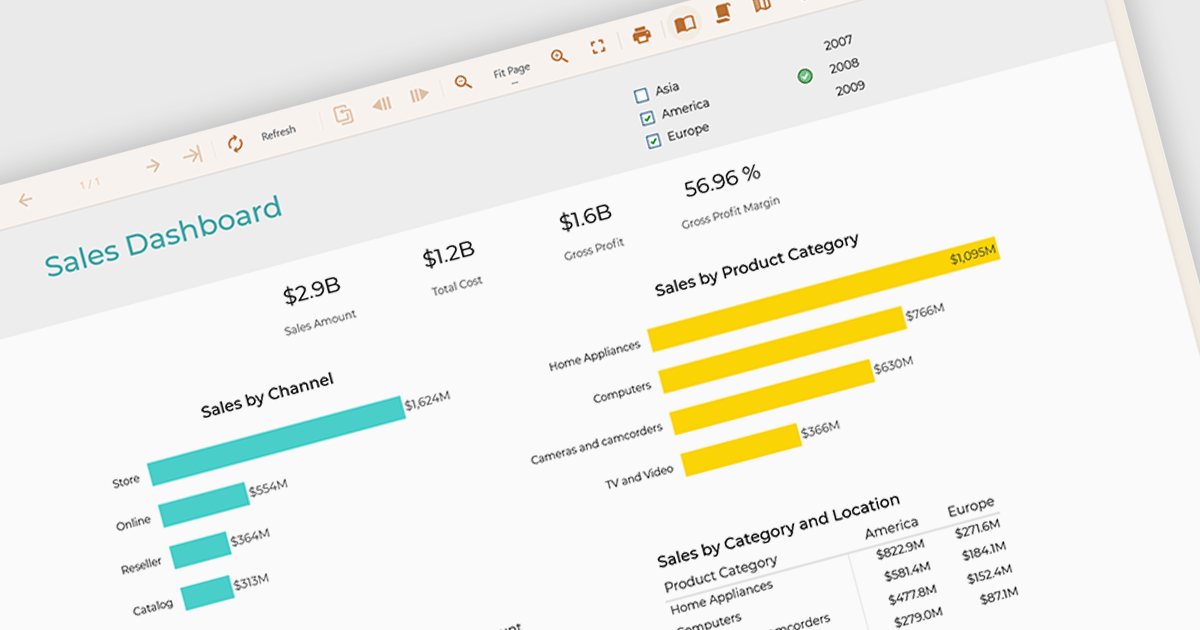
Data filtering and grouping in reporting enables developers to create reports that organize and display data based on user defined criteria, making complex datasets more accessible and actionable. Filtering allows users to focus on the most relevant records, while grouping structures data into meaningful categories that reveal trends, patterns, and relationships. Together, these capabilities improve report clarity, reduce the time required to analyze information, support more informed decision making, and provide a more flexible and efficient reporting experience for both technical and business users.
Several JavaScript reporting controls offer data filtering and grouping including:
For an in-depth analysis of features and price, visit our comparison of JavaScript Reporting Controls.

For the past three years, ComponentSource and Jspreadsheet have worked together to provide developers with powerful spreadsheet and data management solutions for modern web applications. Jspreadsheet offers Excel like functionality for JavaScript, React, Angular, and Vue applications, helping teams create interactive data grids, forms, dashboards, and business applications that can handle large volumes of data with exceptional performance.
A key product in this collaboration is Jspreadsheet Pro, the brand’s flagship spreadsheet component. Featuring more than 400 built in formulas, advanced data handling capabilities, and extensive customization options, it enables developers to deliver familiar spreadsheet experiences directly within their web applications while maintaining full control over data integration and persistence.
This partnership helps ComponentSource differentiate its product offering by providing customers with a market leading spreadsheet solution that complements its extensive portfolio of developer tools. Through ComponentSource’s global sales, licensing, and support services, developers worldwide can easily discover, evaluate, purchase, and deploy Jspreadsheet Pro within their projects.
Learn more about Jspreadsheet.
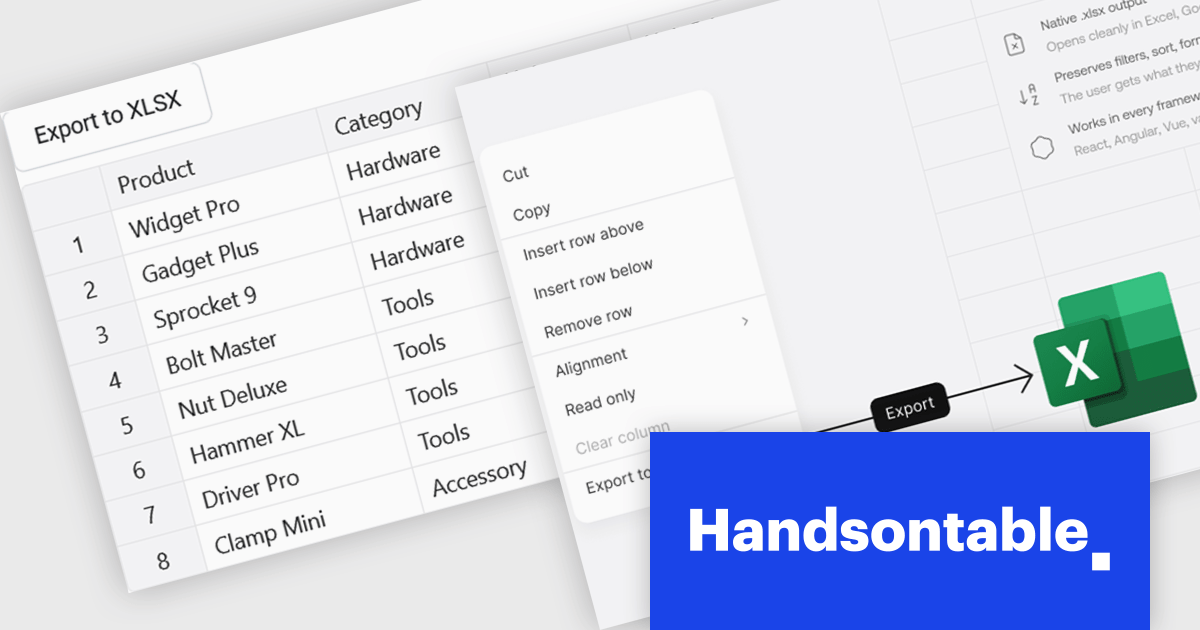
Handsontable is a JavaScript library designed to help developers build interactive data grids into their web applications. Offering a familiar spreadsheet-like interface, it allows users to edit, sort, and filter data with ease. Highly customizable and compatible with popular frameworks like React and Angular, Handsontable empowers developers to build robust data manipulation features into their web applications.
The Handsontable 17.1.0 update includes native export to Excel support, allowing users to save rendered grid data directly to XLSX format. The export reflects the current view of the table, including column order, visible columns, applied filters, sort order, frozen rows and columns, and merged cells. Cell types such as numbers, dates and checkboxes are mapped to their Excel equivalents where possible, helping exported files open cleanly in Microsoft Excel, Google Sheets and Apple Numbers without additional formatting or data preparation. This makes it easier to share and analyze data while maintaining the structure and context users see within the grid.
To see a full list of what's new in version 17.1.0, see our release notes.
Handsontable is licensed per developer and is available as an Annual or Perpetual license with 1 year support and maintenance. See our Handsontable licensing page for full details.
For more information, visit our Handsontable product page.





Tel: (888) 850 9911
Fax: +1 770 250 6199


