


Official Supplier
As official and authorized distributors, we supply you with legitimate licenses directly from 200+ software publishers.
See all our Brands.
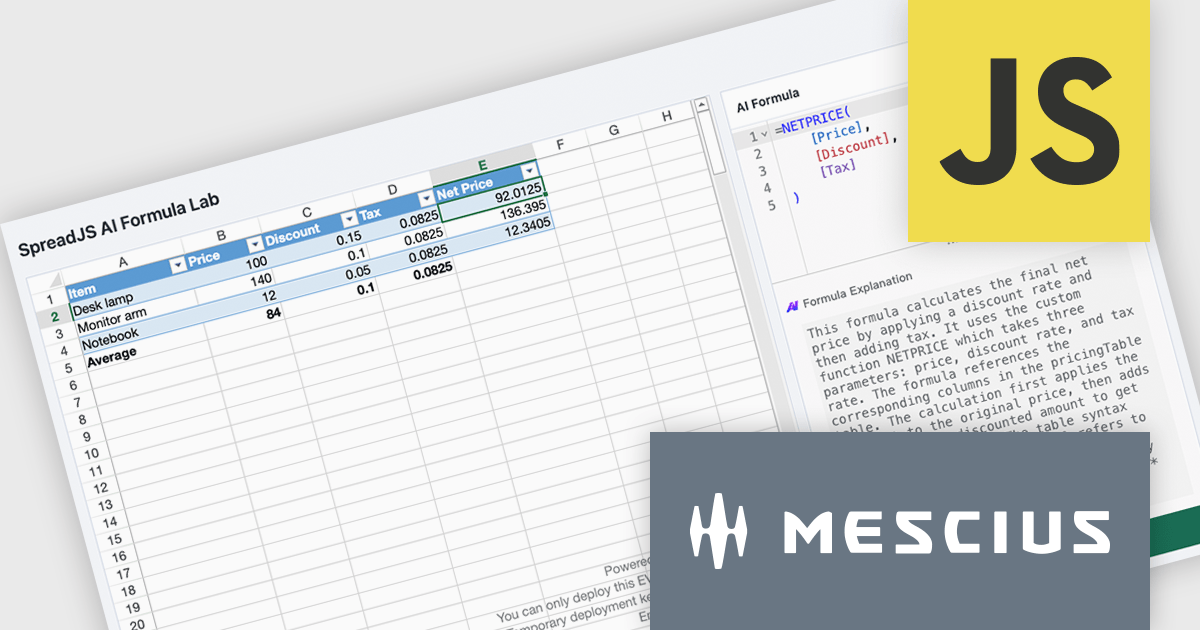
SpreadJS is a complete enterprise JavaScript spreadsheet solution used to create financial reports and dashboards, budgeting and forecasting models, scientific, engineering, healthcare, education, science lab notebooks, and other similar JavaScript business applications. It delivers true Excel-like spreadsheet experiences with zero dependencies on Excel, with full support for React, Vue, Angular, and TypeScript.
In this blog post, MESCIUS Product Manager Chris Bannon shows you how to connect the SpreadJS AI Assistance add-on to a custom-trained Ollama model so it can generate and explain application-specific spreadsheet formulas without requiring you to manually unpack every function, reference, and operator. Steps include:
Detailed code is included to help you along the way.
Read the complete blog and get started unlocking the power of the SpreadJS AI Assistant.
SpreadJS is licensed per developer and includes 1 Year Maintenance (major and minor version releases and unlimited support phone calls). SpreadJS requires an Annual or Perpetual Deployment License. The optional Add-ons are available at an additional cost, and require a SpreadJS license. See our SpreadJS licensing page for full details.
For more information, visit our SpreadJS product page.
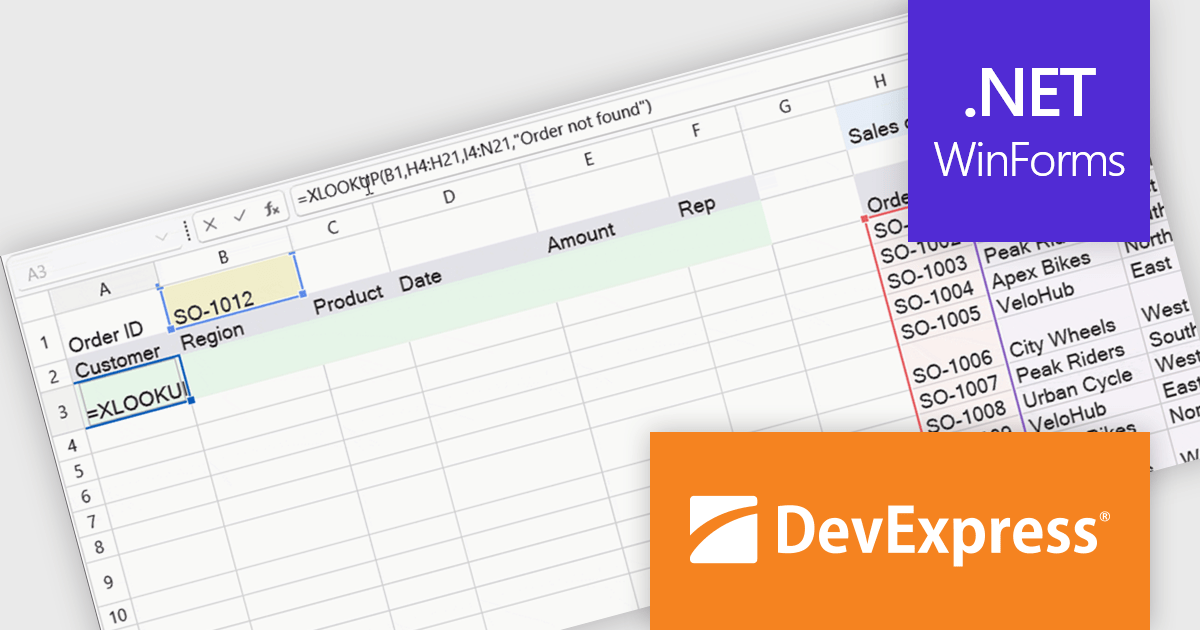
DevExpress WinForms is a comprehensive suite of 190+ UI controls and development tools designed for building high-performance desktop applications. It offers a broad array of customizable controls, from data grids and ribbon interfaces to advanced charts, maps, and diagramming components. This empowers developers to rapidly create functionally rich applications, while adhering to accessibility guidelines and touch-enabled technology for modern Windows environments.
The WinForms Spreadsheet Control in version 26.1 adds support for six new dynamic array-based Microsoft Excel functions: XLOOKUP, XMATCH, SORT, SORTBY, FILTER, and UNIQUE. These additions make it easier to search, sort, filter, and organise spreadsheet data while reducing the need for complex formulas. By matching Microsoft Excel calculation behaviour more closely, the control also helps improve compatibility with existing workbooks and delivers a more familiar experience for users.
To see a full list of what's new in version 26.1, see our release notes.
DevExpress WinForms is licensed per developer and is available as a Perpetual License with a 12 month support and maintenance subscription. See our DevExpress WinForms licensing page for full details.
DevExpress WinForms is available individually or in the following products:
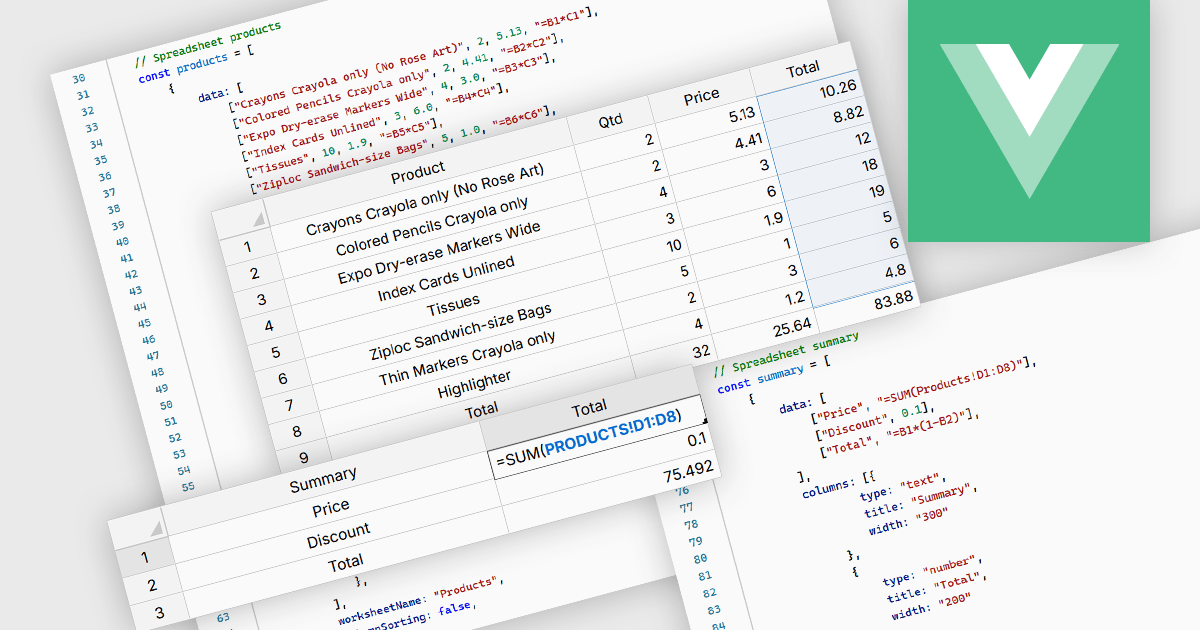
Cross-worksheet calculations allow formulas in one worksheet to reference cells, ranges, or named ranges located in another worksheet within the same spreadsheet. This capability enables related data to be organized across multiple worksheets while preserving links between them, reducing duplicated information, improving consistency, and making complex spreadsheet models easier to manage and maintain.
Several Vue.js spreadsheet components allow you to perform cross-worksheet calculations, including:
For an in-depth analysis of features and price, visit our comparison of Vue.js spreadsheet components.
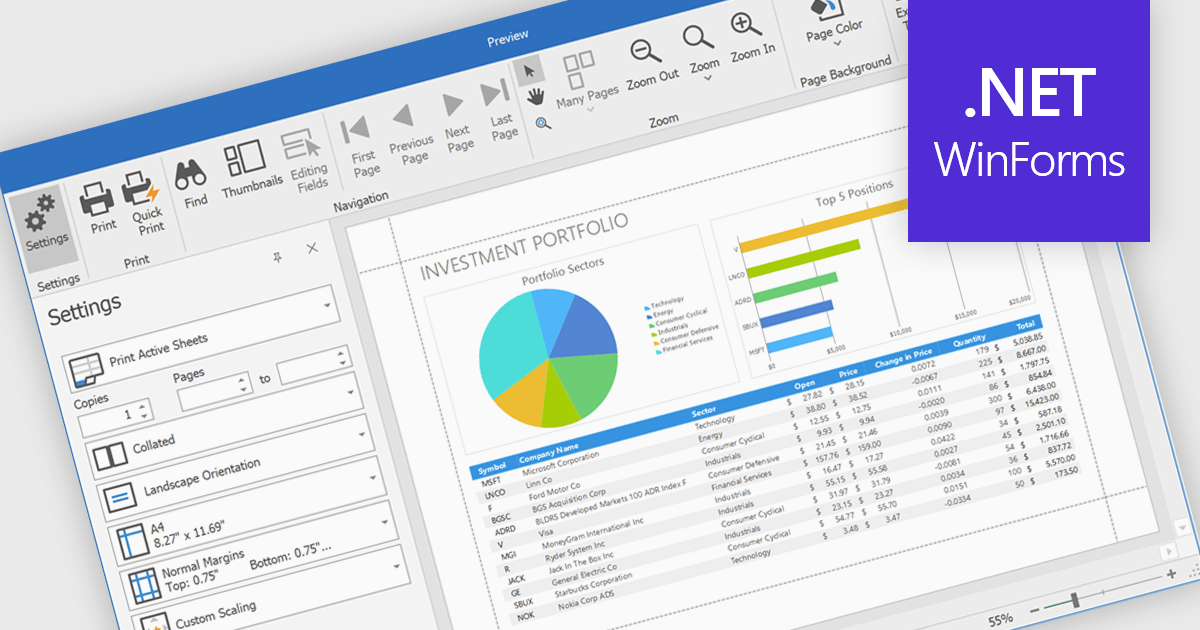
Printing spreadsheets enables users to produce high quality hard copies of worksheets while preserving formatting, tables, charts, images, and page layouts. Features such as print preview, page scaling, margins, and page break controls help ensure content fits correctly on the page, reducing the need for manual adjustments and improving readability. This makes spreadsheet printing valuable for business reports, financial statements, invoices, schedules, inventory lists, project plans, and other documents that need to be shared in meetings, distributed to stakeholders, archived for compliance, or reviewed offline.
Several .NET WinForms spreadsheet components enable printing, including:
For an in-depth analysis of features and price, visit our comparison of .NET WinForms spreadsheet components.
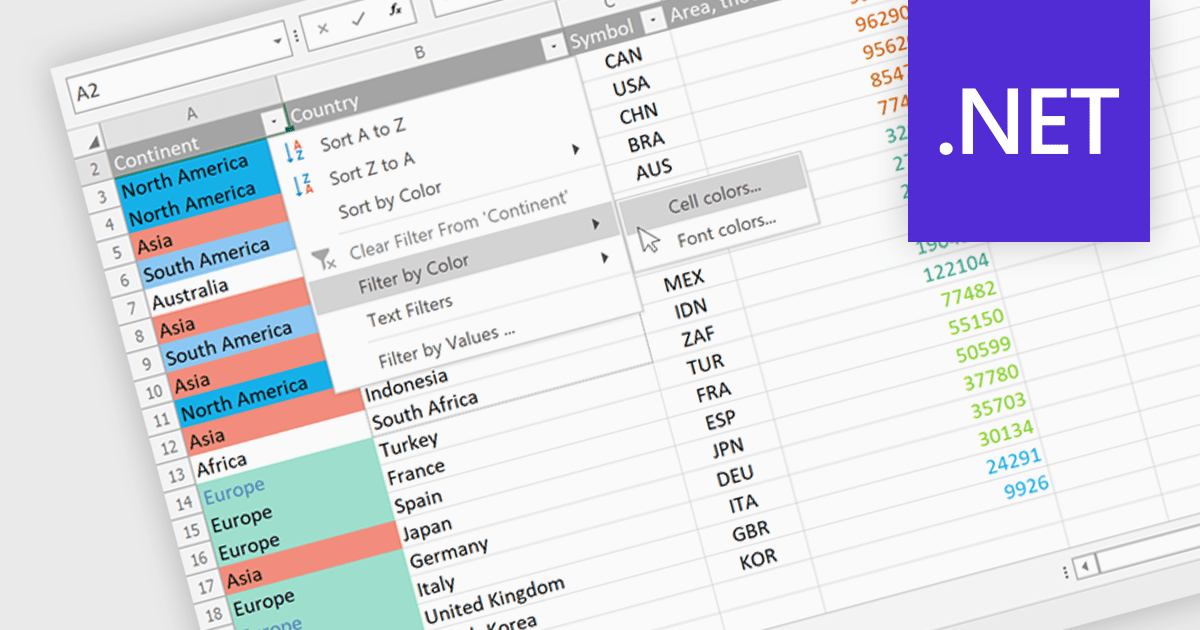
Data Filtering and Grouping in a .NET spreadsheet control enables developers to organize and display worksheet data more effectively by allowing users to filter rows based on specific criteria and group related rows or columns into expandable sections. These capabilities make it easier to work with large datasets, focus on relevant information, improve worksheet navigation, and present data in a more structured way without modifying the underlying content. By supporting familiar Excel-style functionality, data filtering and grouping also help create more intuitive business applications while maintaining compatibility with spreadsheet workflows.
Several .NET Spreadsheet controls offer data filtering and grouping including:
For an in-depth analysis of features and price, visit our comparison of .NET Spreadsheet controls.


Tel: (888) 850 9911
Fax: +1 770 250 6199


