dotTrace - Application - V3.1 - Resumen

de JetBrains - Tipo de producto: Aplicación

Resumen

dotTrace by JetBrains

A profiling solution for profiling the performance and memory use of your .NET applications. 
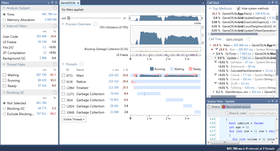
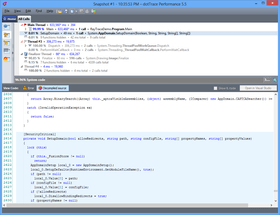
dotTrace profiles the performance of .NET applications, the memory usage of .NET applications, ASP.NET applications running on Internet Information Server and Windows services. dotTrace program interface features effective navigation, easy filtering and smart search options. dotTrace also features source preview.

Memory profiling - dotTrace is now capable of profiling the memory usage of your .NET applications. The profiling process stays just as simple: launch the profiled application, choose the "Memory profiling" option, and then tell the profiler when to take the snapshot of current memory.

As with performance profiling results, memory snapshots allow you to inspect and analyze profiling data for as long as you need, save it and share with others, or put several saved snapshots side by side after you've made changes to the code.

dotTrace offers two ways to profile memory – To check what objects are currently loaded in memory (but shouldn’t be), you can dump memory at any time during profiling. To also view the difference between two application memory states, during profiling you can mark the start and the end of a time interval, then capture a snapshot containing the difference data. A difference snapshot lets you see how much new memory was allocated and how much was released during the marked time interval. The view can be filtered to show only Live objects, only New objects, only Dead objects, only Garbage objects, or the difference between New and Dead objects.

Exploring profiling results - Each memory snapshot holds a wealth of data on all objects allocated in memory, from the roots (Stack, Finalizer, Garbage Collector Handle, Application Domain Static, and Thread Static) to every single object allocated or deleted at any time during the profiling session.

A number of options and snapshot views are available to you for examining and analyzing the results of memory profiling. Any set of objects — an object, class, namespace, or root — can be opened in its own separate tab for closer inspection.

Class List — this default view shows the list of classes with the number of objects allocated, amount of memory used, number of held objects and amount of held memory for each class. Classes can be sorted according to memory used or the number of objects for the class

Namespace Tree — shows the breakdown of memory usage by subsystems (namespaces)

Outgoing references — shows outgoing references from all objects of the current tab

Incoming references — shows all objects that referenced each object of the current tab

Shortest root path — shows the shortest path to the root from each object in the current tab

Objects in outgoing and incoming references views can be grouped by type.

Allocation Tree — this view displays the call stacks at which objects were allocated, and an additional pane displaying the types of objects allocated at the selected stack frame. It closely resembles the Call Tree of the performance snapshot (also available in both By Thread and All Threads variations)

Find objects by class (Ctrl+N) - dotTrace provides the rapid Find objects by class search feature which should be very familiar to users of JetBrains ReSharper (its keyboard shortcut is also assigned to Ctrl+N). The use of wildcards and CamelCase abbreviations is supported for faster search results.

Performance profiling enhancements - Performance profiling in dotTrace has been enhanced with a number of features.

Quick Info - Now you can look up Quick Info on any function from the Call Tree view. The lookup window provides a summary of function statistics with respect to the selected call and to all calls in the current tab.

Better filtering options - dotTrace makes it much easier to see all the data you want to see and none that you don't.

Folding filtered calls -Chains of filtered calls can be set to be folded by default or folded/unfolded manually from the Call Tree view

Folding recursive calls - Recursive call chains can be folded to display the aggregate timings and call counts of all functions called recursively

Hide functions with 0% of root time - Functions that consumed 0% of root time can be hidden from view

Performance snapshot comparison - dotTrace is now able to compare any two performance snapshots of the same application. It generates a comparison snapshot which shows the difference in the number of calls and times spent in each function. Comparison snapshots can be viewed and analyzed the same way as regular performance snapshots.

New profiling options - JIT inlining disabling option has been added. This lets you choose sides in the tradeoff between greater measurement consistency (that is, when the code you wrote is not inlined, application call structure is preserved, even at the cost of some overhead) and profiling your application in true "field conditions."

Additional enhancements

Main and finalizer threads are now indicated by new special icons

Hot spots calculation can now be canceled in case of an excessive number of functions

Double-clicking a function in bottom pane of Plain View now navigates to that function in the top pane

Thread names are shown in thread list (in By Thread view)

Copy signature/subtree to clipboard — you can copy to clipboard the signature of the function selected in any view; you can also copy any subtree in Call Tree view (in text format, like the Export Current View command)

Multiple snapshots - dotTrace now handles multiple snapshots, providing you with all-around profiling convenience. First, you can generate more than one snapshot of the same application as you profile it. Second, you can open several snapshots at the same time, so that you can compare and contrast them (for performance snapshots, this can even be done automatically).

Windows services profiling - dotTrace lets you easily profile Windows services. Just select the service from the list of all available Windows services and profile it the same way as web applications.

Integration with Visual Studio - Run dotTrace from Visual Studio — with the click of the button you can profile the StartUp project of your solution in Visual Studio. In addition, if you have the JetBrains ReSharper add-in installed on your Visual Studio, you can easily start profiling unit tests from the code editor. Open a file from dotTrace in Visual Studio — if your solution is opened in Visual Studio, you can click a quick link in Source View to navigate to the corresponding source file in Visual Studio.

Source View improvements - The Source View now highlights all areas of code relevant to the function currently selected in the upper view. Its new Gutter with highlight stripes — like ReSharper's right-hand gutter in Visual Studio — lets you quickly navigate between the highlighted areas by clicking the yellows stripes.

Better Find function - The Find Function allows you to do more things with your search results:

Highlight function in the current tab

Open function in a new tab

Show Quick Info on the function

It also understands wildcards and CamelCase notation for faster search.

Configuring source lookup - To make sure dotTrace looks in the right place for source files, you can specifically configure folder substitutions. If your code has been moved, dotTrace will use the folder substitutions to locate the program database file and display the source code correctly. This also lets several users share snapshots and still see the correct source code on their local machines.

What's new in dotTrace V3.1?

Performance profiling enhancements - dotTrace 3.1 handles many more profiling scenarios, with 2 new profiling modes: Thread-time CPU profiling and Sampling CPU profiling. In the sampling mode, you are able to profile the performance of your application much faster, but at the expense of lower accuracy. With Thread-time profiling, you can measure the contribution of individual threads in multithreaded applications, reducing interference between threads. Other enhancements include individual tab saving and more support for filtering and folding function calls in several views.

Memory profiling enhancements - dotTrace 3.1 gives you another means for spotting memory leaks - finalized objects. You can now see all objects that were deleted by the finalizer and not properly disposed of in the code of your application. Among other enhancements is the possibility to merge strongly-connected objects in groups as well as navigation to classes' source in source preview. Also, information about held and reachable objects is now serialized to disk, eliminating the necessity to recompute it on each memory snapshot opening.

Other important improvements - With dotTrace 3.1, you can now do more with your ASP.NET applications. They can be profiled from Microsoft Visual Studio and also run using Visual Studio Development web-server (as an alternative to IIS). Individual tabs can now be saved as separate snapshots. Also, dotTrace helps you profile your older applications in those profiling modes which are not supported for the .NET 1.1 framework, by automatically creating an appropriate .config file.

What's new in dotTrace V3.0?

Versatile profiling modes - dotTrace offers two additional performance profiling modes: Sampling profiling (vs. Tracing profiling) and Routine thread time measurement (vs. Wall time measurement). A total of 4 possible profiling modes are now available. Sampling profiling is a profiling method which is up to 30 times faster than regular tracing profiling, but at the expense of lower accuracy. It is extremely useful for at least two profiling scenarios: first, quickly getting a general idea of your application's performance, and second, profiling for extensive periods of time, up to many hours long. Routine thread time is measured by a thread-specific timer which is paused when its thread is paused. Using this mode, dotTrace can measure the contribution of individual threads in multithreaded applications, reducing interference between threads.

Tab saving - Individual tabs in performance snapshots may be saved as separate snapshots.

Finalized objects - dotTrace lets you see finalized objects - objects which were deleted by the finalizer. You can examine them to find that some were not properly disposed of in the code of your application, which is a potential memory leak

Merging strongly-connected objects - When you are navigating though the graph of objects in memory, some dependencies are difficult to see at a glance. dotTrace offers an easy way to merge (group) strongly-connected objects together, so that you can see which objects and/or groups any particular node is holding

General Features - ASP.NET applications can now be profiled from Microsoft Visual Studio. Also, in addition to Internet Information Server, web applications can be profiled using Visual Studio Development server

PartNumbers: PC-517704-154942 517704-154942 PC-517704-154948 517704-154948 PC-517704-154944 517704-154944 PC-517704-154946 517704-154946

PurchaseOptions: dotTrace V3.1 1-9 User License - Commercial License (price per license) , dotTrace V3.1 1-9 User License - Commercial License (price per license) - Upgrade from previous version , dotTrace V3.1 10-49 User License - Commercial License (price per license) , dotTrace V3.1 50+ User License - Commercial License (price per license)

Resources: Read the dotTrace Data Sheet - Requires Acrobat Reader, Read the dotTrace License Agreement, Download the dotTrace V3.1 evaluation on to your computer - Expires After 10 Days

Operating System for Deployment: Windows XP, Windows Server 2003, Windows 2000

Architecture of Product: 32Bit

Product Type: Application

Keywords: JetBrains Jet Brains Jet Brain JetBrain Development Professional Partner jetbrains dottrace, dottrace, dot Trace

Búsqueda de productos

Escriba palabras de búsqueda:

Enlaces

Autor

Categoría principal

Productos relacionados

Award