Proveedor oficial
Como distribuidores oficiales y autorizados, le suministramos licencias legítimas directamente de más de 200 editores de software.
Ver todas nuestras marcas.
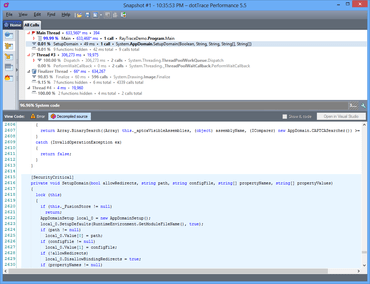
dotTrace Performance profiles the performance of .NET and ASP.NET applications. You can compare any two performance snapshots of the same application. The dotTrace program interface features effective navigation, easy filtering and smart search options and source preview.
JetBrains is a leading software development firm specializing in the creation of intelligent, productivity-enhancing software technology. The company is widely known for their innovative, award-winning products, IntelliJ IDEA, ReSharper and TeamCity. JetBrain's products are trusted and used everyday by developers in over 3,000 companies worldwide, many from the Fortune 100. JetBrains has headquarters in Prague, Czech Republic and R&D centers in Russia, Germany and the USA.

A profiling solution for profiling the performance of your .NET applications.
Chatee en vivo ahora mismo con nuestros especialistas en licencias de JetBrains.