


Proveedor oficial
Como distribuidores oficiales y autorizados, le suministramos licencias legítimas directamente de más de 200 editores de software.
Ver todas nuestras marcas.
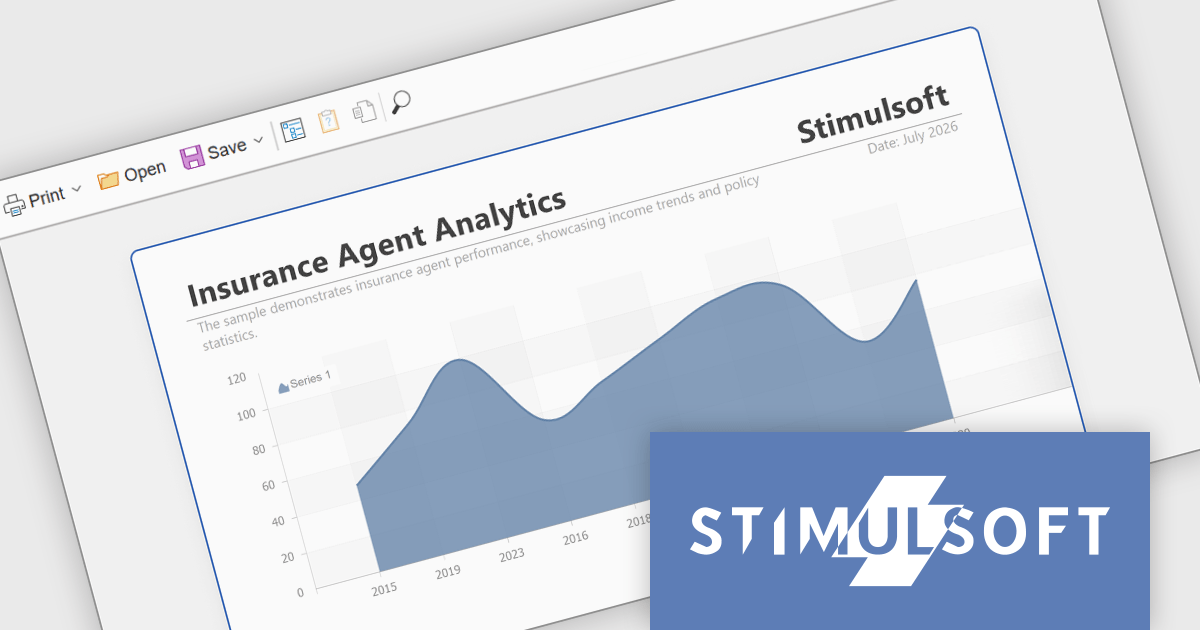
Stimulsoft Ultimate is a reporting and dashboard solution that provides a set of tools for building interactive reports and data visualizations across platforms, including WinForms, ASP.NET, .NET Core, Blazor, JavaScript, WPF, PHP, Java, and Avalonia. It enables developers and organizations to design, generate, and deploy professional reports and dashboards using visual designers, flexible styling options, rich charting and data visualization components, and extensive data connectivity. With support for multiple development environments and technologies, Stimulsoft Ultimate helps teams improve report creation, maintain consistent designs, and deliver clear, data-driven insights for business intelligence, analytics, operational reporting, and enterprise applications.
The Stimulsoft Ultimate 2026.3.1 release adds a report viewer for Vue.js, giving developers a native way to integrate report viewing into modern Vue applications without relying on generic web components or framework workarounds. This provides a more consistent development experience, making it easier to embed interactive reports, maintain application architecture, and deliver responsive user interfaces. For organizations building new single-page applications or modernizing existing systems with Vue.js, the new viewer offers greater flexibility when incorporating reporting capabilities while helping to reduce integration effort.
To see a full list of what's new in 2026.3.1, see our release notes.
Stimulsoft Ultimate is licensed per developer with Single, Team, Enterprise, and WorldWide options that support one to unlimited developers within an organization. Licenses include a 12 month subscription with updates, priority technical support, a royalty free runtime report designer and viewer, and a build server license for Team and higher tiers. See our Stimulsoft Ultimate licensing page for full details.
Learn more on our Stimulsoft Ultimate product page.
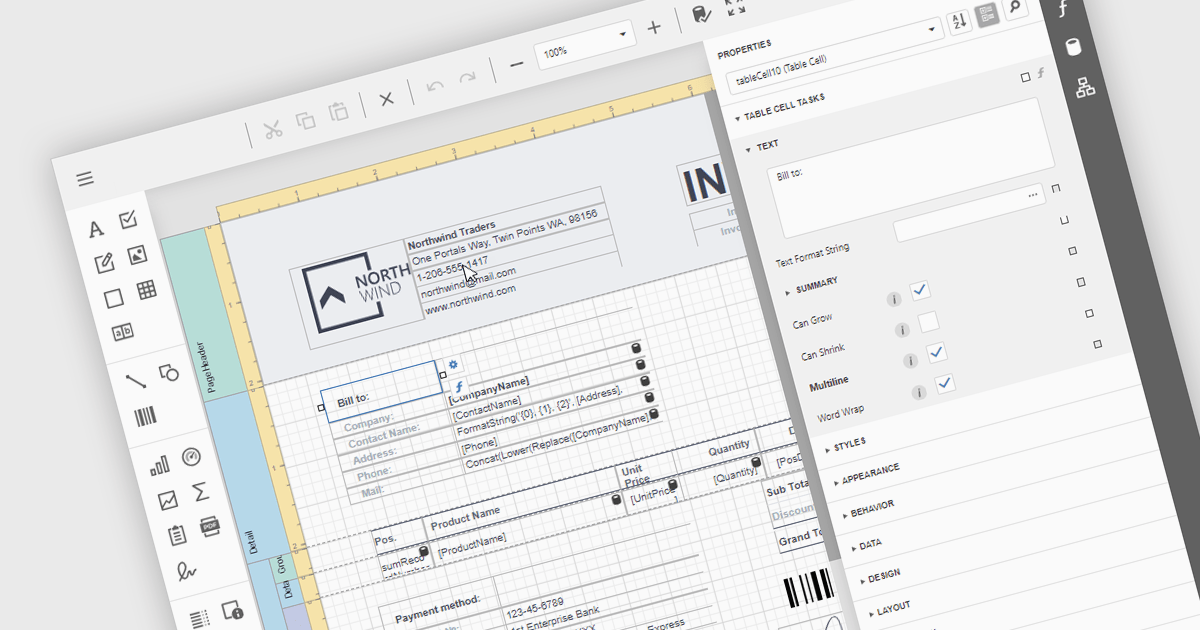
An end user report designer is a visual tool that allows non-technical users to create, edit, and customize report layouts directly within an application, without needing to write code or rely on developers. Typically featuring an intuitive drag-and-drop interface, it enables users to arrange data, apply formatting, configure layouts, and define filters and expressions to meet changing business requirements. This allows organizations to deliver reporting changes more quickly, gives users greater control over their reporting needs, and enables development teams to focus on more complex application work.
Several React reporting components provide you with an end user report designer, such as:
For an in-depth analysis of features and price, visit our comparison of React reporting components.
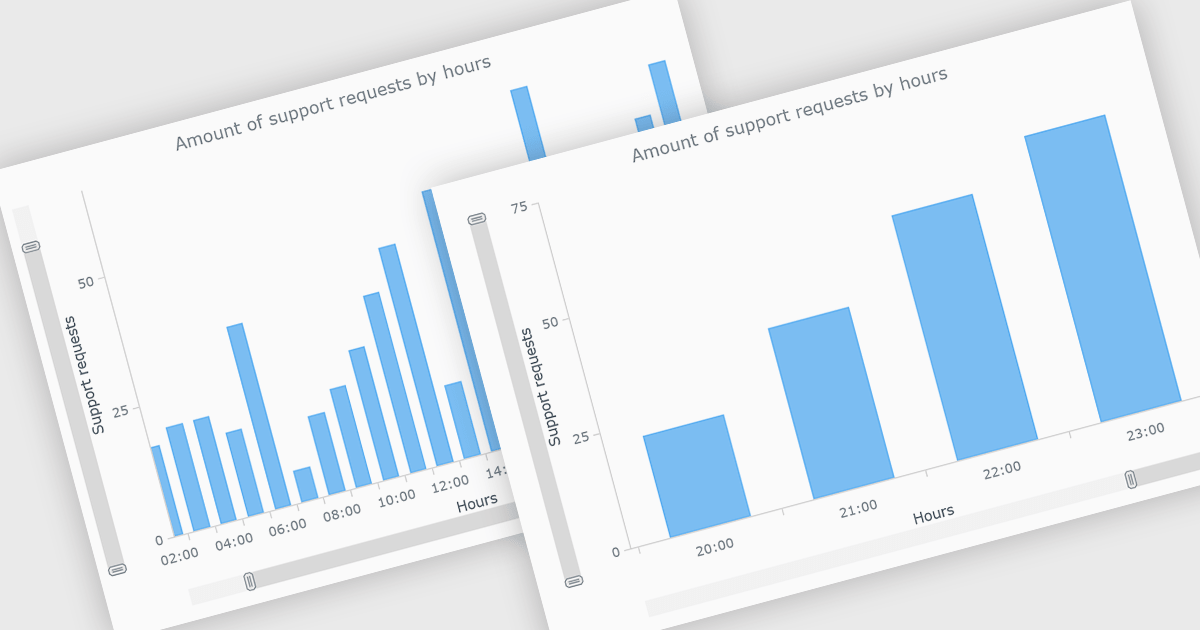
Chart scrolling lets users navigate large datasets by moving horizontally or vertically through a chart without displaying all data points at once. This improves readability, reduces visual clutter, and makes it easier to explore specific time periods, categories, or value ranges while maintaining access to the full dataset. It is particularly useful for dashboards, financial reports, business intelligence applications, and other data-intensive visualizations where users need to analyze large volumes of information efficiently.
Several jQuery chart controls offer Funnel charts including:
For an in-depth analysis of features and price, visit our jQuery chart controls comparison.
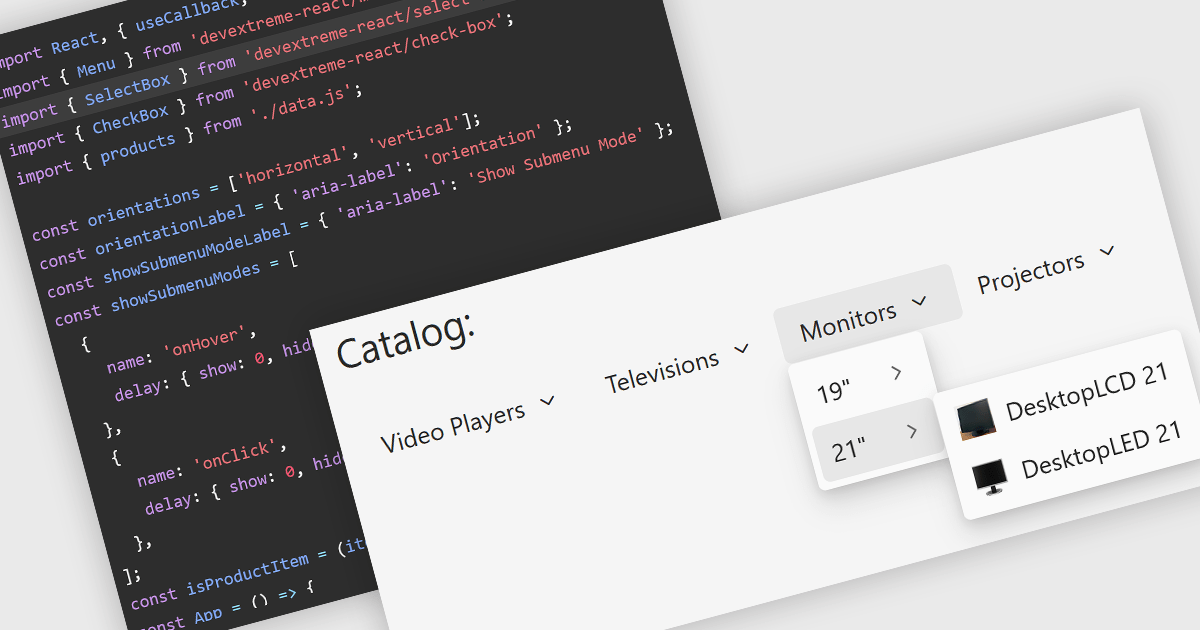
Menu components are a fundamental part of modern UI suites, providing structured navigation and quick access to commands, actions, and application features. They help developers create intuitive user experiences across desktop and web applications by supporting common interaction patterns such as context menus, navigation menus, toolbars, and hierarchical menu structures, while offering customization options to match application design and accessibility requirements.
Several React UI suites offer menu components including:
For an in-depth analysis of features and price, visit our React UI suite comparison.
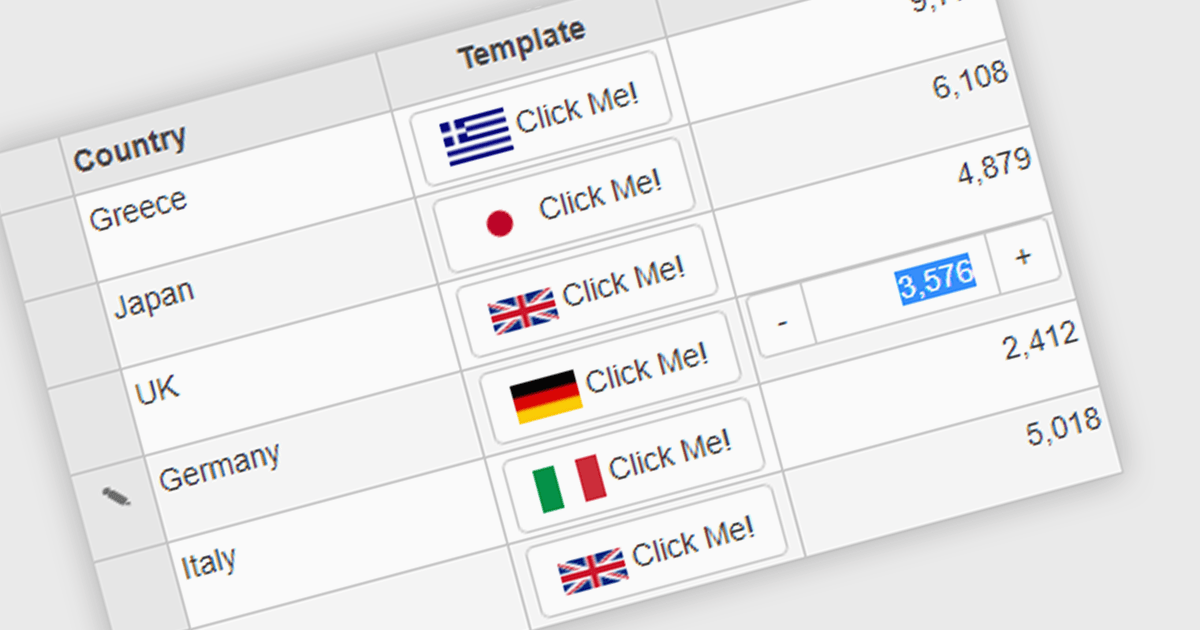
Button cell types allow developers to embed interactive buttons directly within grid cells, enabling users to perform actions such as editing, deleting, viewing details, launching dialogs, or executing custom commands without leaving the grid. By keeping actions closely associated with the relevant data, button cell types reduce unnecessary navigation, and improve usability. This makes them well suited to business applications such as customer relationship management systems, inventory management, financial dashboards, and administrative tools, where users frequently perform row-level actions on large datasets.
Several Angular grid controls offer support for button cell types, including:
For an in-depth analysis of features and price, visit our Angular Grid controls comparison.
Tel: (888) 850 9911
Fax: +1 770 250 6199


