
FusionCharts XT
JavaScript (HTML5) enterprise-grade charts and graphs for dynamic web applications.
Published by FusionCharts
Distributed by ComponentSource since 2020
Prices from: $ 77.42
JavaScript (HTML5) enterprise-grade charts and graphs for dynamic web applications.
Published by FusionCharts
Distributed by ComponentSource since 2020
Prices from: $ 77.42

Please note that FusionCharts new licenses are available as part of FusionCharts Suite
FusionCharts Suite is available as an Annual and Perpetual licenses.
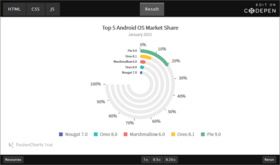
FusionCharts XT is an industry leading JavaScript charting component. Leveraging the power of JavaScript (HTML5), FusionCharts XT functions seamlessly on PCs, Macs, iPads, iPhones and a majority of other mobile devices. It is a perfect addition to your reports, dashboards, surveys, monitors and analytics. Its comprehensive range of chart types with smart reporting capabilities, animations and interactivity are bound to make your apps look stunning and power-packed. It works with both JSON & XML data, and can integrate with any server-side technology (ASP.NET, PHP, Python, Java, Ruby on Rails etc.) and database you use. With the extensive documentation and readymade demos it offers, you will need just 15 minutes to create your first chart. FusionCharts XT is the trusted charting component of over 21,000 customers, including a majority of Fortune 500 companies, and 450,000 developers in over 118 countries.


Image 1 / 11
Advantages of Using FusionCharts XT:
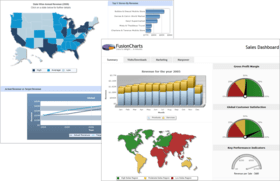
Using FusionCharts XT, you can quickly and easily render delightful charts for your end users.
The same delight across devices, browsers and platforms
PCs, Macs, iPads, iPhones or Android devices, FusionCharts XT brings the same delight to all of them. It works with all your web and mobile applications that are rendered within a browser, including even IE6. Who says the web is fragmented?
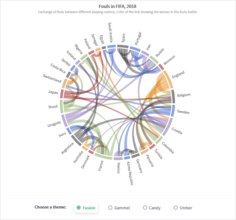
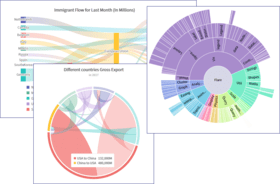
The industry's most comprehensive charting library with over 90 chart...

FusionCharts XT is also available in:
Live Chat with our FusionCharts licensing specialists now.


Tel: (888) 850 9911
Fax: +1 770 250 6199


