Screenshot Preview

Infragistics NetAdvantage for SharePoint

de Infragistics - Tipo de producto: Complemento

Por favor note que al menos que se indique lo contrario, esta es la versión en Inglés del producto.

*

Extend your SharePoint Experience with easily configurable and scalable Web parts. 
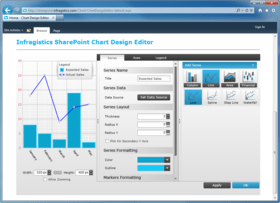
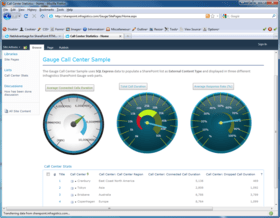
Infragistics NetAdvantage for SharePoint allows business users to visualize their data quickly and easily with a rewarding design experience. It includes a set of Web parts that you can deploy on your SharePoint servers for your team. These include interactive charts and gauges, maps that provide the right level of detail at the right zoom level, a content rotator that animates multimedia content, and a visually compelling version timeline with which you can quickly see relationships between documents and the people who manage them. Infragistics NetAdvantage for SharePoint allows business users to visualize their key business metrics in charts and gauges. Its rich user interface allows them to quickly bind data to the charts and gauges, whether from a SharePoint list, an Excel Services spreadsheet, or an external data source exposed through BCS. Infragistics NetAdvantage for SharePoint extends Microsoft SharePoint functionality with customizable Web parts that make it even easier to share information with others, manage documents from start to finish, and publish reports to help everyone make better decisions.

Desde
₩6,020,100

Nuestros precios Standard están indicados abajo. Inicia una sesión para ver sus precios con descuento.

Precio en Vea: Todos los precios | Solo renovaciones

Infragistics NetAdvantage for SharePoint 2011   *

Añadir a la Cesta ₩ 6,020,100 1 Server Subscription License - Includes updates, upgrades and new components for 1 year  *
Ref. Fabricante: 69Y0C
Descarga (50.5 MB)
Añadir a la Cesta ₩ 5,117,100 1 Server Subscription License - 90-Day Early Bird Subscription Renewal - (can be purchased up to the end of the 10th month of your existing subscription)  *
Ref. Fabricante: 699990
Verificar Descarga (50.5 MB)
Añadir a la Cesta ₩ 5,418,100 1 Server Subscription License - 60-Day Early Bird Subscription Renewal - (can be purchased between the first and last day of the 11th month of your existing subscription)  *
Ref. Fabricante: 699960
Verificar Descarga (50.5 MB)
Añadir a la Cesta ₩ 6,020,100 1 Server Subscription License - Subscription Renewal - (can be purchased until the last day of the 12th month of your existing subscription)  *
Ref. Fabricante: 699900
Verificar Descarga (50.5 MB)

Infragistics NetAdvantage for SharePoint 2011 with Priority Support   *

Añadir a la Cesta ₩ 9,033,200 1 Server Subscription License with Priority Support - Includes updates, upgrades and new components for 1 year  *
Ref. Fabricante: 69Y0CP
Descarga (50.5 MB)
Añadir a la Cesta ₩ 7,678,200 1 Server Subscription License with Priority Support - 90-Day Early Bird Renewal - (can be purchased up to the end of the 10th month of your existing subscription)  *
Ref. Fabricante: 69999P
Verificar Descarga (50.5 MB)
Añadir a la Cesta ₩ 8,129,900 1 Server Subscription License with Priority Support - 60-Day Early Bird Renewal - (can be purchased between the first and last day of the 11th month of your existing subscription)  *
Ref. Fabricante: 69996P
Verificar Descarga (50.5 MB)
Añadir a la Cesta ₩ 9,033,200 1 Server Subscription License with Priority Support - Subscription Renewal - (can be purchased until the last day of the 12th month of your existing subscription)  *
Ref. Fabricante: 69990P
Verificar Descarga (50.5 MB)

Nuestros precios incluyen servicio técnico de ComponentSource y, para la mayoría de los productos disponibles para descarga, una copia de seguridad en línea y una actualización GRATUITA a la nueva versión si ésta se publica en un período de 30 días después de la compra.  Todas las ventas están sujetas a nuestros Términos y condiciones standard y a nuestra Política de devolución. Por favor, póngase en contacto con nosotros si necesita alguna opción de licencia no ofrecida en la lista, como por ejemplo volumen de licencias y versiones anteriores.

Nuestros precios Standard están indicados arriba. Inicia una sesión para ver sus precios con descuento.

 *

Infragistics NetAdvantage for SharePoint includes:

Version Timeline - Review Your Document History Over Time - Totally manage your document library. Follow files created at specific times and apply author filters. You can even Un-publish major versions if required with the Version Timeline Web part. Ensure that your users have the most up to date information with the Version Timeline Web part. This Web part provides a graphic view of different versions of a document across a horizontal timeline so that your team has access to the latest revision of any document. You can track individuals’ contributions so that when people collaborate on a document, you can quickly track each person’s changes. Views and Features include:

  • Minor and Major Version View
  • Time Spans definitions, e.g., last week, last month, etc.
  • Filter by user
  • Ability to compare item versions

Content Rotator - Promote everything from company activities, announcements, news, products launches and more using the Content Rotator Web part. Point to banners and videos from multiple sources and create content with captivating animations, titles, and descriptions. Key features include:

  • Image preview
  • Content preview (rich text content)
  • Playback controls / End-user navigation
  • Description
  • Title

Data Chart - Enjoy a seamless design experience that allows you to spend your time interpreting your data rather than figuring out how to see it and present it. If your data is in a SharePoint list, or exposed through Microsoft BCS (Business Connectivity Services) you can point to your data and quickly define the axes of your chart. Customizing the look and feel of the chart is simple, as is overlaying multiple data sets onto the same chart. Data Chart types include:

  • Area Series
  • Column Series
  • Line Series
  • Spline Area Series
  • Spline Series
  • Step Area Series
  • Step Line Series
  • Waterfall Series
  • Range Area Series
  • Range Column Series

Gauge - Create dashboards of Key Performance Indicators by binding your data to the Gauge Web part. You can customize both radial and linear gauges to demonstrate where trouble begins and ends, so that you can quickly spot business areas that require your attention. Use single display value radial or linear gauges to provide sales forecasts based on information regularly processed from your data warehouse. Engineering organizations can create sophisticated radial or linear gauges with multi-value displays to expose insights such as quality control information with near real-time defect rates.

  • Radial Gauge: Use the multi-scale, round or semi-round Radial Gauge dials and create key performance indicators with the look and feel of an automotive console or aircraft cockpit.
  • Linear Gauge: Use the Linear Gauge in the same way you would use a classic thermometer. Display values as one or more straight line measurements that you can orient vertically or horizontally.

Map - Using open data sources like Microsoft Bing, Open Street Map and Geographic Information Systems you can build interactive multi-layered maps in no time. It’s straightforward to apply a data source with appropriate geographical information to a map and format the result to provide a visual representation of the data. For example, you could show population density by country and drill down to state, county and even deeper as needed. Energy companies could show the distribution of oil wells and other assets. Sales managers can display sales results by region and drill down to show local offices. The Map Web part includes the following key features:

  • Map Layers
  • Map Tile Source
  • Elements (points / pins) layer
  • Path layer
  • Navigational panes
  • Color Swatch panes
  • Color map elements and paths
  • Scale panes

Key Features

  • Multi layered Maps-Create rich mapping applications that allow you to overlay your own value-added map elements. Get an instant view and show anything including seating charts, floor plans, warehouse contents, and yes—geographic maps, too.
  • Geo-Imagery Support – Enable users to deep zoom into satellite, aerial, remote sensing, street map, or other kinds of tiled imagery from several popular service providers.
  • Customizable Layout - Design the layout of legends, the navigation pane and all other aspects of map layers, map elements to fit the application you are building.
  • Geospatial Data Integration - Associate your own data sources (e.g., a .dbf file or Microsoft SQL Server 2008) with map elements. Geometry and geography data types are supported.
  • Color Model - Comprehensive coloring ability and choropleth shading enables you to fulfill many common mapping scenarios such as mapping states or county populations, color-coding regions by rainfall amount or any other business data and scaling colors to the data value range.

Atención

Para su comodidad, hemos incluido enlaces a Google Translate para traducir la información del producto que todavía tenemos que traducir. Por favor, tenga en cuenta que traducciones automáticas no siempre son totalmente exactas.
Con la tecnología de
Requiere Flash en Firefox y Opera

Búsqueda de productos

Escriba palabras de búsqueda:

¿Por qué comprar en ComponentSource?

ComponentSource ofrece un único servicio global, utilizado por más de 1.000.000 de desarrolladores en todo el mundo.

Más Información | Sobre Nosotros

Award