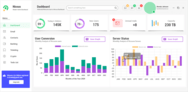
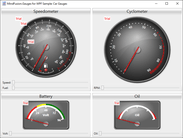
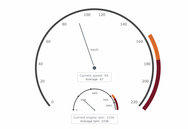
Data visualization components implement the functionality to view data in tables or data grids, as simple charts or complex graphs and enables you to create sophisticated management dashboards using gauges, maps and flowcharts.
Add interactive charts and maps to your apps and websites.
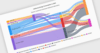
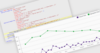
Responsive Stock Charts - Highcharts Stock's responsiveness goes beyond simply fitting the chart to the dimensions of its container. It also automatically finds an optimal placement for non-graph elements such as legends and headings.
Advanced data visualization for more informative reports.
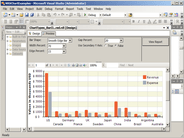
Nevron Chart for SSRS - Delivers a complete set of 2D and 3D chart types, customizable axes, data integration and visual effects to your reports. An indispensable tool for any Business Intelligence, scorecard or scientific report.
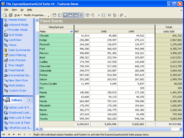
Build responsive, interactive JavaScript data grids and tables.
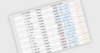
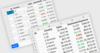
Conditional Formatting - Easily customize the look and feel of your grids and tables using conditional formatting to render content differently based on a value. You can perform row, column or cell formatting.
.
Create stock or general timeline charts for your Web and mobile apps.
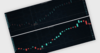
Stock and Timeline Charts - Highcharts Stock provides a wide range of dynamic, responsive stock chart types and timelines which can be used to visualize the most complex data in an understandable, user-friendly format.
Add platform independent diagramming to your application.
Diagram Shapes - Over 100 predefined node shapes are available for you to choose from and you can also define your own. The connectors also provide a variety of customization options, they can be straight lines, curves, start and end with various arrowhead shapes, change color and position.
Add financial, scientific, engineering and business charts to your applications.
Graph Types - Includes many different chart types: Line, Bar, Point/Scatter, Area, Points plus Best-Fit-Curve, Spline, High-Low Line, High-Low Bar, High-Low-Close, Open-High-Low-Close, Box Plot/Candlestick, Bubble and Step.
Build applications for Windows, Web, mobile and tablet.
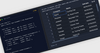
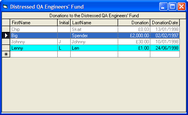
WinExplorer HTML Templates - HTML-CSS templates allow you to override the default data presentation in all view styles. Use HTML markup to specify content for WinExplorer View items and use CSS code to customize the appearance, size, padding and layout of UI elements.
A pure JavaScript library for creating responsive, interactive charts for React apps.
Accessibility - Create interactive charts that empower people with disabilities. Users are able to navigate and interact with charts using the keyboard or voice input and they can use sonification to play back charts using sound.
Award-winning .NET and JavaScript controls for mobile, Web and desktop.
Grid Column Menus - FlexGrid for Blazor now has built-in column menus to sort, filter, group and resize columns. Users can easily invoke the menu by clicking on the ellipses button beside the column name.