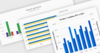
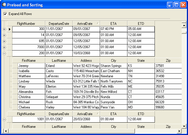
Data visualization components implement the functionality to view data in tables or data grids, as simple charts or complex graphs and enables you to create sophisticated management dashboards using gauges, maps and flowcharts.
Advanced data visualization for more informative reports.
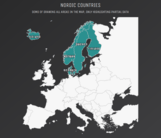
Nevron Map for SSRS - Provides report authors with an easy and powerful way to create choropleth and informative maps that are integrated with data. A perfect complement to any report that displays geographical data of any type.
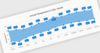
Add interactive charts and maps to your apps and websites.
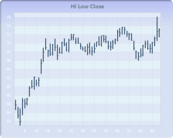
Responsive Stock Charts - Highcharts Stock's responsiveness goes beyond simply fitting the chart to the dimensions of its container. It also automatically finds an optimal placement for non-graph elements such as legends and headings.
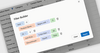
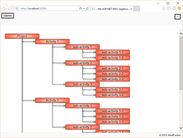
Create simple, flexible and highly customizable organization charts.
Templates - OrgChart JS includes a number of predefined templates. It also allows you to inherit from a template and override its properties to create your own custom templates to suite your needs.
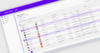
Diagramming components for dependency visualization and analysis.
Annotating Diagram Nodes - Annotations are API elements that are attached to diagram nodes. The annotations don't affect node placement in any way and, as a result, the control redraws them instantaneously without re-rendering or recalculating the diagram layout.
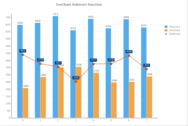
Easily Generate Rich Charts - Actipro Charts supports many chart types from basic line and bar charts to complex stacked area charts. It includes useful features such as multiple series, labels, legends, stacking, and customizable palettes.
Provides Visual C++ MFC developers with a professional set of modern controls.
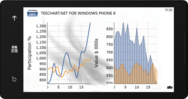
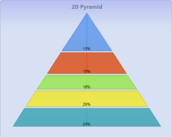
Codejock Chart Pro - Chart types include Bar, Point, Line, Pie, Radar, Polar, Area, Financial, Gantt, Funnel, Pyramid, Graphing and Analysis. Charts are fully customizable allowing you to create virtually any charting style.
Every map type you need - Highcharts Maps includes a wide range of vector-based map types including map area, map line, points of interest, bubbles on maps and heatmaps.
A pure JavaScript library for creating responsive, interactive charts for React apps.
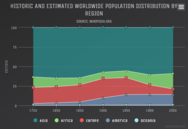
All the Chart Types you Need - Display your data in the most suitable way. Highcharts supports area, bar, column, gauge, heat map, line, pie, polar, range, scatter, spline, waterfall, and many more chart types.
Deliver amazing user experiences on the WinForms platform.
Diagram Designer - Allow your end-users to create and display diagrams of various types and styles. The users can also modify existing diagrams, save diagrams to numerous file formats and load previously saved diagrams.