資料視覺化元件


最新新聞

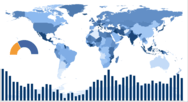
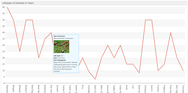
Explore Hierarchical Data with Sunburst Charts
June 25, 2026Product Update
LightningChart JS v8.3 introduces Sunburst charts, enabling intuitive exploration of hierarchical data with clear multi level part to whole insights.
Build Charts on the Latest Java Platforms
June 25, 2026Product Update
EspressChart version 7.2 adds Jakarta EE 11, JDK 21, and Tomcat 11 support for improved performance, security, and compatibility.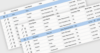
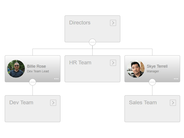
用行級編輯高效管理資料
June 24, 2026功能焦點
用行編輯簡化資料管理,從而允許使用者直接在網格中更新記錄,實現更快、更準確的工作流程。

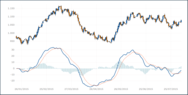
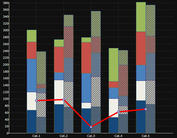
用圖表指標更快辨識趨勢
June 23, 2026功能焦點
用一個綜合了支持與阻力、勢頭和趨勢方向的綜合指標分析市場趨勢。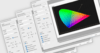
支援全球使用者使用多語言預覽列印
June 22, 2026功能焦點
LightningChart .NET 幫助開發人員為國際使用者創建更易訪問和當地語系化的列印體驗。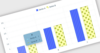
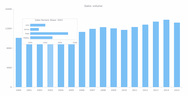
用圖表工具提示嵌入互動洞察
June 18, 2026功能焦點
提供對詳細、上下文圖表資料的即時訪問,該資料有助於使用者探索洞察、比較數值並做出明智決策。