Screenshot Preview

Syncfusion Essential Chart - Summary

by Syncfusion - Product Type: Component / ASP.NET WebForms / ASP.NET AJAX (ATLAS) / ASP.NET MVC / .NET WinForms / .NET WPF / Silverlight / Source Code / JavaScript / AJAX

Summary

Syncfusion Essential Chart by Syncfusion

URLs: syncfusion-essential-chart, syncfusion essential chart, syncfusionessentialchart, syncfusion

Add charts to your .NET applications. 
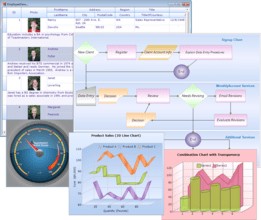
Syncfusion Essential Chart is a business-oriented charting component which offers an innovative data object model that makes it easy to populate a chart with any kind of data source. Syncfusion Essential Chart features an advanced styles architecture that simplifies complex multilevel formatting. It can handle data in different ways. You can add data points to a series and let the chart manage them. Alternatively, you can achieve easier data binding to a data set using the built-in ChartDataBindModel control, and you can specify column names containing the x- and y-coordinate values. For additional flexibility, you can implement the IChartSeriesModel interface and plug-in a custom model. Syncfusion Essential Chart includes components for Windows Forms, ASP.NET, ASP.NET MVC, Silverlight and WPF platforms.

Syncfusion Essential Chart for Silverlight Chart Types

Essential Chart supports many chart types. The following section contains these various types.

Column Chart

Bar Chart

Line Chart

Area Chart

Bubble and Scatter Chart

Accumulation Chart

Financial Chart

Pie and Doughnut Chart

Circular Chart

Syncfusion Essential Chart for Silverlight Chart Elements

Many customization options are available in Essential Chart for Silverlight, including multiple axes support, which allows you to use multiple axes in a chart to display data series positioned relative to their own axes.

Axis Customization

Chart Legend

Indexed Chart Series

Axis Label Customization

Date-Time Range Customization

Zooming

Range Padding and Calculation Mode

Annotations

LegendIcon

LogarithmicAxis

Smaller Ticks

StripLine

Syncfusion Essential Chart for Silverlight Chart Data

Essential Chart facilitates binding data to a chart from different business objects, and plotting this data to analyze scenarios with real-time values. It enables users to bind data from data sources such as IList instances, Observable Collections, Collections, and LINQ results.

Syncfusion Essential Chart for Silverlight Chart Series

Essential Chart provides various customization options for a chart series--such as adornments, segment labels, color models, and chart series effects.

Adornment and Segment Label

Color Palette

Chart Series Effects

Chart Animation

Interactive Cursor

Mouse Events

EmptyPoint

Tooltips

Syncfusion Essential Chart for WPF Chart Appearance

Essential Chart provides a variety of effects to customize the background of the chart and its parts such as chart-areas and chart series.

Background

3-D Charts

3-D Chart Customization

Chart Skins

Adornments

Segment Labels

Annotations

ChartHeader

ChartVisualStyle

Syncfusion Essential Chart for WPF Chart Area

A chart area can be customized in various ways. It supports SyncChartAreas.

SyncChartAreas

LazyLoadingSupport

ContextMenuCustomization

RangeSelection

Syncfusion Essential Chart for WPF Export Options

Essential Chart for WPF allows users to copy a chart to a clipboard, export to an image file, and print portions of a chart.

Syncfusion Essential Chart for WPF Chart Legend

Legends that identify a series in a chart are supported. A legend's appearance or positioning is completely customizable. Users can also add custom legends to charts.

Legend Customization

Legend Positioning

Syncfusion Essential Chart for WPF Heat Map

The HeatMap control helps visualize graphical representations of data where values are measurements of two variables selected from items in a data source.

Syncfusion Essential Chart for WPF Axis Features

Many customization options are available for chart axes in Essential Chart for WPF. Axes can be inverted, gridlines can be rendered to indicate axis intervals, and strip-lines can be rendered to cover areas of the axes.

Axis-Label Customization

Data Types

Gridlines

Inverted Axis

Secondary Axis

Stripline

Label Positioning

LogarithmicAxis

RetainingAxisPosition

Syncfusion Essential Chart for WPF Chart Types

Essential Chart offers many different chart types, which can be easily configured to suit any user's needs. It supports the customization of charts both at the series and individual point levels. Combining compatible chart types is supported and so are stacking modes for certain chart types.

Accumulation Charts

Area Charts

Bar Charts

Circular Charts

Column Charts

Financial Charts

Line Charts

Pie Chart

Scatter Charts

FastChartTypes

Syncfusion Essential Chart for WPF Chart Data

Essential Chart for WPF can be populated with points in many different ways. It supports data from sources such as Observable Collections, LINQ results, databases, IList, XML data, and Collection Views.

Syncfusion Essential Chart for WPF Interactive Elements

Build interactive charts to provide users with a rich run-time experience. Enable Essential Chart's built-in zooming features to let end-users zoom and focus on portions of a chart. Built-in toolbars and context menus also let end-users customize the appearance of a chart during runtime.

Picking Chart Types

Zooming

ToolTip

Toolbar

Properties Dialog

InteractiveCursor

Syncfusion Essential Chart for WPF Chart Series

Essential chart provides various customization option for Chart series. This includes highlighting a single series, single datapoint, displaying or hiding empty points, and much more.

Empty Points

Visibility On Legend

BindingArrayObjects

IDictionaryListSupport

Syncfusion Essential Chart for ASP.NET General Features

Essential Chart is a data visualization tool that helps you generate professional graphs and charts. It supports a large variety of chart types and sports an object-oriented API that is easy to use.

Unlimited Data Series

Unlimited Data Points

Chart Wizard

Zooming and Scrolling

Panning for Zoomed Chart

Smart Labels

Template Support

AJAX Support

Syncfusion Essential Chart for ASP.NET Chart Types

Many chart types ranging from simple column charts to complex financial charts are offered in Essential Chart for ASP.NET. All of these can be configured to suit users needs. All charts except Radar and Polar charts can be rendered in 3-D mode.

Area Charts

Bar Charts

Column Charts

Line Charts

Financial Charts

Pie and Doughnut Charts

Bubble and Scatter Charts

Accumulation Charts

Circular Charts

Combination Charts

Heat Map Chart

Syncfusion Essential Chart for ASP.NET Axis Features

The default chart control settings include the primary x- and y-axes. The chart control framework also provides complete support for the inclusion of multiple x- and y-axes.

Gridlines

Axis Line Type

Axis Ticks

Axis Label Customization

Axis Label Orientation

Axis Custom Origin

Axis Strip Line

Automatic Range Scaling

Axis Custom Range

Custom Polar-Axis Range

Opposed Axis

Inverted Axis

Secondary Axis

Logarithmic Axis

Scale Break

Multiple Axes Layout

Chart Axis Labels

Custom Polar Axis

Syncfusion Essential Chart for ASP.NET Title Appearance

A chart title can be customized to suit the needs of the user. Its font style, size, and color can be modified. The alignment and position of the chart title can also be specified. Essential Chat also supports multiple chart titles.

Title Font Customization

Title Position

Title Alignment

Multiple Chart Titles

Syncfusion Essential Chart for ASP.NET Alter Series Data and Style

The Chart control comes with a rich style architecture that separates the display styles from the data model and provides flexibility in the appearance and definition of each display element. Style forms the core of the Chart control and provides extensive customization. It can be inherited from a parent chart, which makes complex formatting relatively easy.

Series Chart Control

Empty Point

Custom Point

Statistics Support

Data Point Style

Data Point Label

Grouping Support

Chart and Grid Interaction

Syncfusion Essential Chart for ASP.NET Chart Data

Essential Chart can handle data in different ways. You can add data points to a series and let the chart manage it. Alternatively, achieve easier data binding to a data set using the built-in ChartDataBindModel control and specify the column names containing the x and y coordinate values. For additional flexibility, you can implement the IChartSeriesModel interface and plug-in your custom model.

Default Data Population

Data Binding to DataSet

Axes Label Binding

Custom Data Model

Excel Import-Export

LINQ Support

Syncfusion Essential Chart for ASP.NET Chart Appearance

A chart's appearance can be customized by setting individual chart element properties. The rich styles architecture available for the Chart control provides formatting options at both point level and series levels.

3-D Mode

Clustered Mode

Spacing Effect

Anti-aliasing

Alpha Blending

Built-in-Skins

Chart Background

Chart Interior

Chart Border

Series Border

Chart Font

Color Palette

Shadow Effect

Data Point Symbol

Localization

Multiple Pies

Syncfusion Essential Chart for ASP.NET Chart Legend Appearance

A chart legend, which is a symbol-based caption, is rendered for each series in a chart by default. There is also support for adding custom chart legends. There are also customization options for its appearance. Essential Chart supports multiple chart legends as well.

Docking and Alignment

Border Style

Title Font and Color

Representation Type

Visible Check Box

Background Image

Item Alignment

Multiple Chart Legends

Syncfusion Essential Chart for ASP.NET Interactive Elements

User interaction adds to the appeal of any control. Keeping this in mind, the Chart control has been designed to be completely user-friendly and supports several user-interaction elements.

AutoHighlight

Drag-and-Drop Data Point

Interactive Cursor

Toolbar

Context Menu

Get Point or Value

Navigation links

Syncfusion Essential Chart for Windows Forms General Features

Chart and Data Wizard

Chart Real-Time and Recorder

Smart Labels

Template Support

Unlimited Data Points

Unlimited Data Series

Zooming and Scrolling

Panning support for Zoomed chart

Chart Localization support

Syncfusion Essential Chart for Windows Forms Chart Types

Essential Chart offers many chart types, ranging from simple column charts to complex financial charts, which can be easily configured to suit the needs of any user. All charts, except radar and polar charts, can be rendered in 3-D mode.

Accumulation Chart

Area Chart

Bar Chart

Bubble and Scatter Charts

Circular Chart

Column Chart

Combination Chart

Financial Charts

Line Chart

Pie and Doughnut Charts

Heat Map Chart

Syncfusion Essential Chart for Windows Forms Axis Features

By default, the chart control comes with two primary axes: X and Y. The chart control's framework also provides complete support for the inclusion of multiple x- and y-axes.

Automatic Range Scaling

Axes Multiple Layout

Axis Label Font

Axis Label Orientation

Axis Line

Axis Strip Line

Axis Ticks

Chart Axis Label

Custom Axis Origin

Custom Axis Range

Custom Polar Axis Range

Grid Lines

Inverted Axis

Logarithmic Axis

Opposed Axis

Scale Break

Secondary Axis

Custom Polar Axis

Syncfusion Essential Chart for Windows Forms Export Options

Essential Chart supports exporting the chart control into various formats. Users can also print chart data.

Export as Image

Export to DocIO

Export to Grid

Export to Excel

Export to PDF

Export to SVG

Print Support

Syncfusion Essential Chart for Windows Forms Alter Series Data and Style

The chart control comes with a rich styles architecture, which separates the display styles from the data model, providing flexibility in the appearance definition for each display element. Styles form the core of the chart control, providing extensive customization. They can be inherited from parent charts, making complex formatting relatively easy.

Chart with Grid Interaction

Custom Point

Data Grouping

Data Point Symbol

Data Point Text

Empty Point

Series in a Chart Control

Statistical Formula Support

Syncfusion Essential Chart for Windows Forms Chart Data

Essential Chart can handle data in different ways. You can simply add data points to a series and let the chart manage it; alternatively, you can use the built-in ChartDataBindModel and specify the column names containing the X and Y values to easily bind data to a data set. For added flexibility, implement the simple IChartSeriesModel interface and plug in your custom model.

Custom Data Model

Data Binding to a Data Set

Axis Label Binding

Default Data Population

LINQ Support

Excel Importing and Exporting

Syncfusion Essential Chart for Windows Forms Chart Appearance

A chart's visual appearance can be customized by setting the properties for individual chart elements. The rich styles architecture available for the chart control provides formatting options at point-level as well as series-level.

3-D Mode

Alpha Blending

Anti-Alising

Built-in-Skins

Chart Area and Series Shadow Effect

Chart Background

Chart Border

Chart Font

Chart Interior

Chart Symbol

Clustered Mode

Color Palette

Localization

Series Border

Spacing Effect

Multiple Pies

Syncfusion Essential Chart for Windows Forms Title and Data Legend Appearance

A chart legend, which is a symbol-based caption, is rendered for each series in a chart by default. There is also support for adding custom legends as well as plenty of appearance customization options. A chart title can also be fully customized, including but not limited to the font, color, size, position, and alignment.

Chart Multiple Titles

Chart Title Alignment

Chart Title Position

Legend Background Image

Legend Border with Different Styles

Legend Dock and Alignment

Legend Item Alignment

Legend Representation Type

Legend Shadow Effect

Legend Title Font and Color

Legend Visible Check Box

Multiple Chart Legends

Title Font Size and Color

Syncfusion Essential Chart for Windows Forms Interactive Elements

User interaction adds to the appeal of any control. Keeping this in mind, the chart control has been designed to be completely user friendly and easily applicable to user interactions.

AutoHighlight

Chart Get Value

Chart Host Control

Context Menu

Drag-and-Drop Series Points

Interactive Cursor

Toolbar

ToolTip

Series Highlight

Syncfusion Essential Chart for ASP.NET MVC Chart Type

Many chart types, ranging from simple column charts to complex financial charts, are offered in Essential Chart. They can be configured to suit any need, and all, with the exception of radar and polar charts, can be rendered in 3-D mode.

Area Charts

Bar Charts

Column Charts

Line Charts

Pie Charts

Accumulation Charts

Combination Charts

Circular Charts

Syncfusion Essential Chart for ASP.NET MVC Axis Features

The default Chart control settings include the primary x- and y-axes. The chart framework also provides complete support for the inclusion of multiple x- and y-axes.

Gridlines

Axis-Line Type

Axis Ticks

Axis-Label Customization

Axis-Label Orientation

Opposed Axis

Inverted Axis

Syncfusion Essential Chart for ASP.NET MVC Alter Series Data and Style

The Chart control comes with a rich style architecture that separates the display styles from the data model and provides flexibility in the appearance and definition of each display element. Style forms the core of the Chart control and provides extensive customization. Style can be inherited from a parent chart, making complex formatting relatively easy.

Syncfusion Essential Chart for ASP.NET MVC User Interaction

Essential Chart supports a zooming feature, the contextmenu support, the toolbar support and the tooltip support for ASP.NET MVC. To enable zooming along the x-axis, use the EnableXZooming property; to enable zooming along the y-axis, use the EnableYZooming property. The Chart control can be zoomed by setting the zoom factor on the server side, or through user interaction. After zooming, scrolling and panning can be used to see all the visible areas of a chart. Scroll the chart area vertically by using the mouse wheel, and scroll horizontally by using the mouse wheel while pressing the space bar. To pan, you can click and drag the chart area to reveal hidden sections.The interactive cursor feature allows the mouse pointer to be placed on a specific data point in a series, creating horizontal and vertical lines that indicate the x- and y-values. These lines can be dragged in order to position them at specific data points. The context menu and the toolbar can be enabled by setting the ShowContextMenu and ShowToolBar property to true. To enable tooltip, use the ShowTooltips property.

Chart Zoom

Scrolling and Panning

Interactive Cursor

ToolBar

ContextMenu

ToolTip

Syncfusion Essential Chart for ASP.NET MVC RealTime Chart

Essential Chart is optimized to deal with real-time data. It can work with a large amount of real-time data to render any type of dynamic chart.

Syncfusion Essential Chart for ASP.NET MVC Chart Data

Essential Chart can handle data in different ways. You can add data points to a series and let the chart manage them. Alternatively, you can achieve easier data binding to a data set using the built-in ChartDataBindModel control, and you can specify column names containing the x- and y-coordinate values. For additional flexibility, you can implement the IChartSeriesModel interface and plug-in a custom model.

Syncfusion Essential Chart for ASP.NET MVC Chart Appearance

A chart's appearance can be customized by setting individual chart element properties. The rich styles architecture available for the chart control provides formatting options at both point and series level.

3-D Mode

Spacing Effect

Anti-Aliasing

Chart Interior

Chart Border

Series Border

Chart Font

Chart Watermark

Chart SeriesSkin

Syncfusion Essential Chart for ASP.NET MVC Chart Legend Appearance

A chart legend is a symbol-based caption rendered by default for each series in a chart. Custom chart legends are supported, and customization options for legend appearance are available as well. Essential Chat also supports multiple chart legends.

Syncfusion Essential Chart for ASP.NET MVC Chart Export

Essential Chart can easily export data in multiple ways: as image files, Word documents, PDFs, and spreadsheets.

Syncfusion Essential Chart for ASP.NET MVC Chart Printing

Essential Chart supports printing in different ways: by just double-clicking the Print button, or calling the PrintingImage function on the client side.

Syncfusion Essential Chart for ASP.NET MVC Skins Support

Essential Chart supports different Chart Model Skins which gives good look and feel of the chart. It affects the Chart BackInterior and ChartInterior property.

Please note: Syncfusion Essential Chart includes Windows Forms, ASP.NET, ASP.NET MVC, Silverlight and WPF components.

What’s new in Syncfusion Essential Chart 2011 Vol 4?

Essential Chart for ASP.NET MVC Mobile

Chart Control - Essential Chart for Mobile MVC is a lightweight, HTML 5 canvas element-based chart control that is easily configurable. It provides high quality, visually rich business charts on mobile platforms. Essential Chart provides support for the following chart types: Line charts, Step line charts, Spline charts, Pie charts, Column charts, Area charts, Step area charts and Spline area charts.

Essential Chart for ASP.NET

ToolTips for Chart Axis Labels - Users can add custom ToolTips to display further information about chart axis labels.

Localization Support - The user interface of a chart can be customized to be locale-specific.

Essential Chart for ASP.NET MVC

Essential Chart with HTML 5 - Essential Chart with HTML 5 is a lightweight, canvas-based chart control that utilizes HTML 5 to implement a very high performance and interactive chart control.

Essential Chart for WPF

TimeLine Control - The TimeLine control can be used to view specific time frames in a chart by allowing users to select a range of data. It can be integrated with other controls like Essential Chart, Essential Grid, and Essential Gantt for selecting and viewing data that falls inside a specific time frame. It has a rich UI for users to interact with.

Essential Chart for Windows Forms

Localization Support - The user interface of a chart can be customized to display chart data according to the language and culture specific to a particular country or region.

ToolTips for Chart Axis Labels - Users can add custom ToolTips to display further information about chart axis labels.

Add charts to your .NET applications.

Pricing: Syncfusion Essential Chart 2012 Vol 2 (V10.2.0.56) - Binary 1 Developer License - with 1 Year Subscription, Syncfusion Essential Chart 2012 Vol 2 (V10.2.0.56) - Binary 1 Developer Annual Subscription Renewal License (for subscriptions soon to expire or up to 30 days past expiration), Syncfusion Essential Chart 2012 Vol 2 (V10.2.0.56) - Binary 1 Developer Reinstatement of Lapsed Subscription License (for subscriptions lapsed longer than 30 days up to one year), Syncfusion Essential Chart 2012 Vol 2 (V10.2.0.56) with Source Code 1 Developer License with Source Code - with 1 Year Subscription, Syncfusion Essential Chart 2012 Vol 2 (V10.2.0.56) with Source Code 1 Developer Annual Subscription Renewal License (for subscriptions soon to expire or up to 30 days past expiration) with Source Code, Syncfusion Essential Chart 2012 Vol 2 (V10.2.0.56) with Source Code 1 Developer Reinstatement of Lapsed Subscription License (for subscriptions lapsed longer than 30 days up to one year) with Source Code, Syncfusion Essential Chart 2012 Vol 2 (V10.2.0.56) - Binary Site License Site License - with 1 Year Subscription - Allows upto 500 Developers at a single address, Syncfusion Essential Chart 2012 Vol 2 (V10.2.0.56) - Binary Site License Site Annual Subscription Renewal License (for subscriptions soon to expire or up to 30 days past expiration) - Allows upto 500 Developers at a single address, Syncfusion Essential Chart 2012 Vol 2 (V10.2.0.56) - Binary Site License Site Reinstatement of Lapsed Subscription License (for subscriptions lapsed longer than 30 days up to one year) - Allows upto 500 Developers at a single address, Syncfusion Essential Chart 2012 Vol 2 (V10.2.0.56) with Source Code Site License Site License with Source Code - with 1 Year Subscription - Allows upto 500 Developers at a single address, Syncfusion Essential Chart 2012 Vol 2 (V10.2.0.56) with Source Code Site License Site Annual Subscription Renewal License (for subscriptions soon to expire or up to 30 days past expiration) with Source Code - Allows upto 500 Developers at a single address, Syncfusion Essential Chart 2012 Vol 2 (V10.2.0.56) with Source Code Site License Site Reinstatement of Lapsed Subscription License (for subscriptions lapsed longer than 30 days up to one year) with Source Code - Allows upto 500 Developers at a single address

Evals & Downloads: Read the Syncfusion Site License Agreement, Read the Syncfusion License Agreement - Requires Acrobat Reader, Read the Syncfusion HTML5 datasheet - Requires Acrobat Reader, Read the Syncfusion Company Brochure - Requires Acrobat Reader, Read the Syncfusion - Overview of products and Suite options document - Requires Acrobat Reader, Read the What you need to know when selecting a chart Whitepaper - Requires Acrobat Reader, Download the Syncfusion User Guide Installer onto your computer, Download the Syncfusion Class Reference Documentation Installer onto your computer, Download the Syncfusion Essential Studio 2012 Vol 2 (V10.2.0.56) evaluation on to your computer - Expires After 30 Days

Operating System for Deployment: Windows 7, Windows Vista, Windows XP, Windows Server 2003, Windows 2000

Architecture of Product: 32Bit

Product Type: Component

Component Type: ASP.NET WebForms, ASP.NET AJAX (ATLAS), ASP.NET MVC, .NET WinForms, .NET WPF, Silverlight, Source Code, JavaScript, AJAX

Built Using: Visual C# .NET

Compatible Containers: Microsoft Visual Studio 2010, Microsoft Visual Studio 2008, Microsoft Visual Studio 2005, Microsoft Visual Basic 2010, Microsoft Visual Basic 2008, Microsoft Visual Basic 2005, Microsoft Visual C++ 2010, Microsoft Visual C++ 2008, Microsoft Visual C++ 2005, Microsoft Visual C# 2010, Microsoft Visual C# 2008, Microsoft Visual C# 2005, .NET Framework 4.0, .NET Framework 3.5, .NET Framework 3.0, .NET Framework 2.0, Silverlight 4

Product Class: User Interface Components

Keywords: syncfusion essential chart, essential chart

Syncfusion Sync fusion

Chart Charting Charts Graph Graphing Graphs

Part numbers: PC-515345-455354 515345-455354 PC-515345-455358 515345-455358 PC-515345-455366 515345-455366 PC-515345-455356 515345-455356 PC-515345-455360 515345-455360 PC-515345-455368 515345-455368 PC-515345-455370 515345-455370 PC-515345-455372 515345-455372 PC-515345-455374 515345-455374 PC-515345-455376 515345-455376 PC-515345-455378 515345-455378 PC-515345-455380 515345-455380