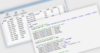
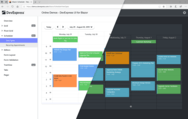
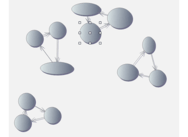
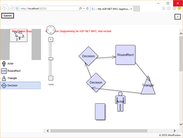
Diagramming components for dependency visualization and analysis.
Annotating Diagram Nodes - Annotations are API elements that are attached to diagram nodes. The annotations don't affect node placement in any way and, as a result, the control redraws them instantaneously without re-rendering or recalculating the diagram layout.
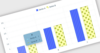
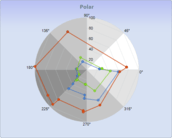
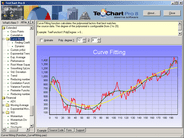
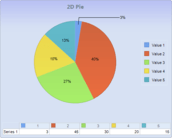
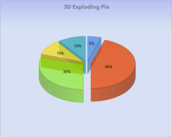
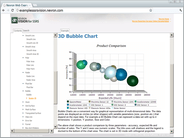
그래프 유형 - 많은 차트 종류를 포함합니다: Bar, Point/Scatter, Area, Points plus Best-Fit-Curve, Spline, High-Low Line, High-Low Bar, High-Low-Close, Open-High-Low-Close, Box Plot/Candlestick, Bubble 및 Step.
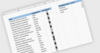
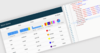
React Pivot Table - 비즈니스 데이터를 구성 및 요약하고 결과를 교차-테이블 형식으로 표시합니다. 데이터 바인딩, 드릴링 업/다운, Excel과 같은 필터링 및 정렬, 편집, Excel 및 PDF 내보내기, 여러 기본제공 집계, 피벗 테이블 필드 목록 및 계산된 필드가 포함 됩니다.
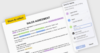
Rich Text Editor - 모든 기능을 갖춘 풍부한 텍스트 편집기를 모든 JavaScript 응용 프로그램에 임베드합니다. 굵게, 밑줄, 기울임꼴, 취소선, 아래첨자 및 위첨자, 텍스트 정렬 및 정렬된 목록을 포함한 텍스트를 생성하고 조작하는 데 도움이 되는 많은 선택 기능이 제공됩니다.