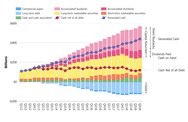
Data visualization components implement the functionality to view data in tables or data grids, as simple charts or complex graphs and enables you to create sophisticated management dashboards using gauges, maps and flowcharts.
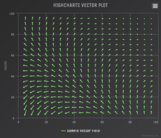
Add interactive charts and maps to your apps and websites.
Map collection - Highcharts Maps includes a collection of maps, optimized for use with Highcharts Maps. For common maps, it saves you the trouble of finding or drawing suitable SVG or GeoJSON maps. Instead, you can choose between hundreds of pre-generated maps of countries, regions and other administration levels.
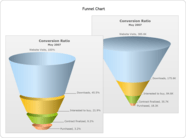
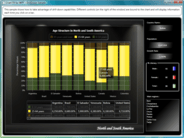
Advanced data visualization for more informative reports.
Nevron Chart for SSRS - Delivers a complete set of 2D and 3D chart types, customizable axes, data integration and visual effects to your reports. An indispensable tool for any Business Intelligence, scorecard or scientific report.
High-performance toolkits for your development projects.
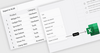
WinUI DataGrid - Used for efficiently displaying and manipulating tabular data, its rich feature set includes data binding, editing, sorting, filtering, grouping and data virtualization. It has been optimized for working with millions of records, as well as handling high-frequency, real-time updates.
A pure JavaScript library for creating responsive, interactive charts for React apps.
Works With Your Stack - The charting libraries work with any back-end database or server stack and data can be given in any form, including CSV, JSON or loaded and updated live. Wrappers for most popular languages and frameworks including Angular, Vue and React are available.
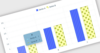
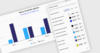
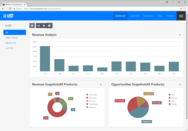
Stunning JavaScript charts for your website or Web application.
Dashboards - JSCharting allows you to quickly create business Dashboards using JavaScript and HTML5 with advanced resolution independent visuals. It has never been quicker or easier to visualize complex data in an intuitive and non-obtrusive way.
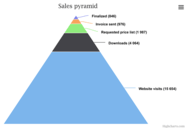
Create simple, flexible and highly customizable organization charts.
Templates - OrgChart JS includes a number of predefined templates. It also allows you to inherit from a template and override its properties to create your own custom templates to suite your needs.
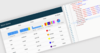
A comprehensive, native Blazor UI components library.
Pivot Table - Organize and summarize data and display the result in a cross-table format. Features include data binding, drilling up and down, Excel-like filtering, sorting, editing, Excel and PDF exporting, built-in aggregations, pivot table field list and calculated fields.
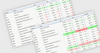
Build applications for Windows, Web, mobile and tablet.
JavaScript Data Grid - With integrated server-side support for summary computations, paging, data filtering, sorting, record grouping and summary computations, extremely large datasets are never an issue for the DevExtreme Data Grid.
Build Web Forms apps for any browser and device in half the time.
Seamless UX Across Devices - Telerik UI for ASP.NET AJAX controls look and work flawlessly across all major browsers: Internet Explorer 6+, Chrome 2+, Firefox 3.6+, Safari 4+ and Opera 10+.