


Fornitore ufficiale
In qualità di distributori ufficiali e autorizzati, forniamo licenze software legittime direttamente da più di 200 autori di software.
Vedi tutte le nostre marche
Continua a leggere in inglese:
Highcharts is a JavaScript charting framework that allows web developers and data analysts to generate dynamic, visually appealing charts and graphs for websites and web applications. It can display a variety of chart types, including line, spline, area, column, bar, pie, scatter, and many more. Highcharts is well-known for its ease of use, rich documentation, and ability to handle huge datasets efficiently. Features include responsive design, accessibility support, and cross-browser compatibility. Its customization capabilities allow users to create bespoke data visualizations that increase engagement and provide insightful data presentations.
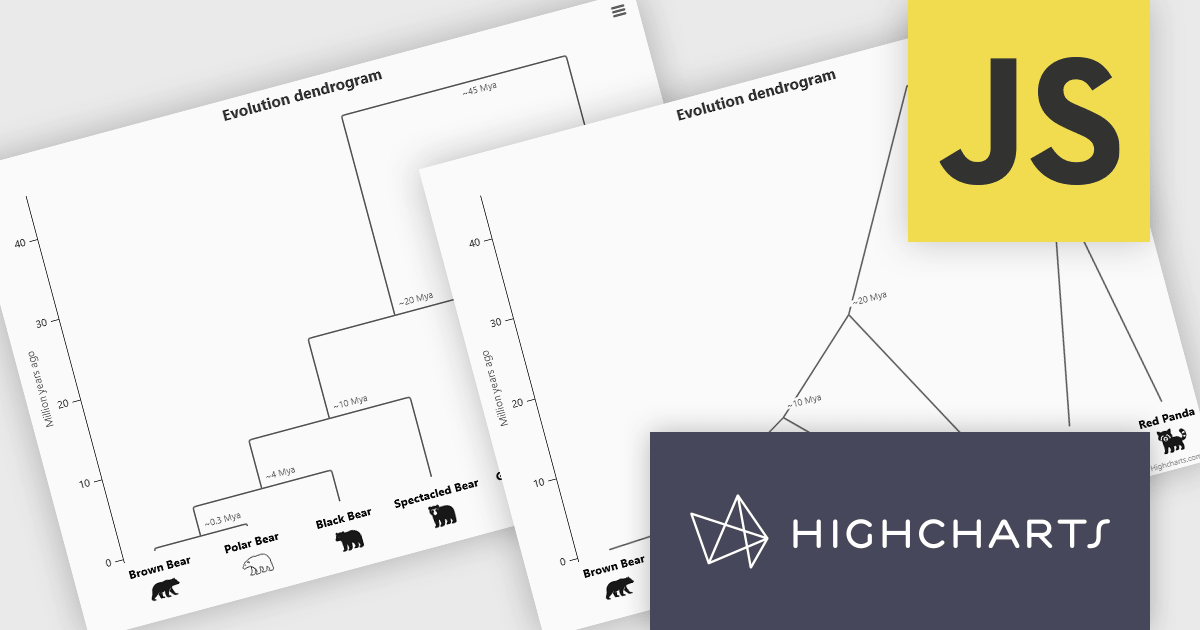
The Highcharts 12.5 update introduces dendrogram support, allowing developers to visualize hierarchical relationships and similarity levels directly within their charts using treegraph-based diagrams. This enhancement makes it easier to represent the output of hierarchical clustering algorithms, taxonomies, and other structured datasets in a clear and interpretable way. By mapping similarity or progression along an axis and using branch height to indicate relationships, developers can present complex hierarchical data more effectively.
To see a full list of what's new in 12.5, see our release notes.
Highcharts Core is licensed on an annual or perpetual basis, OEM licenses, and Advantage Renewals. It is licensed per Developer and has several license options including Internal, SaaS, SaaS+, and Self Hosted. See our Highcharts Core licensing page for full details.
Learn more on our Highcharts Core product page.


Tel: (888) 850 9911
Fax: +1 770 250 6199


