Visualize Data Across Orders of Magnitude
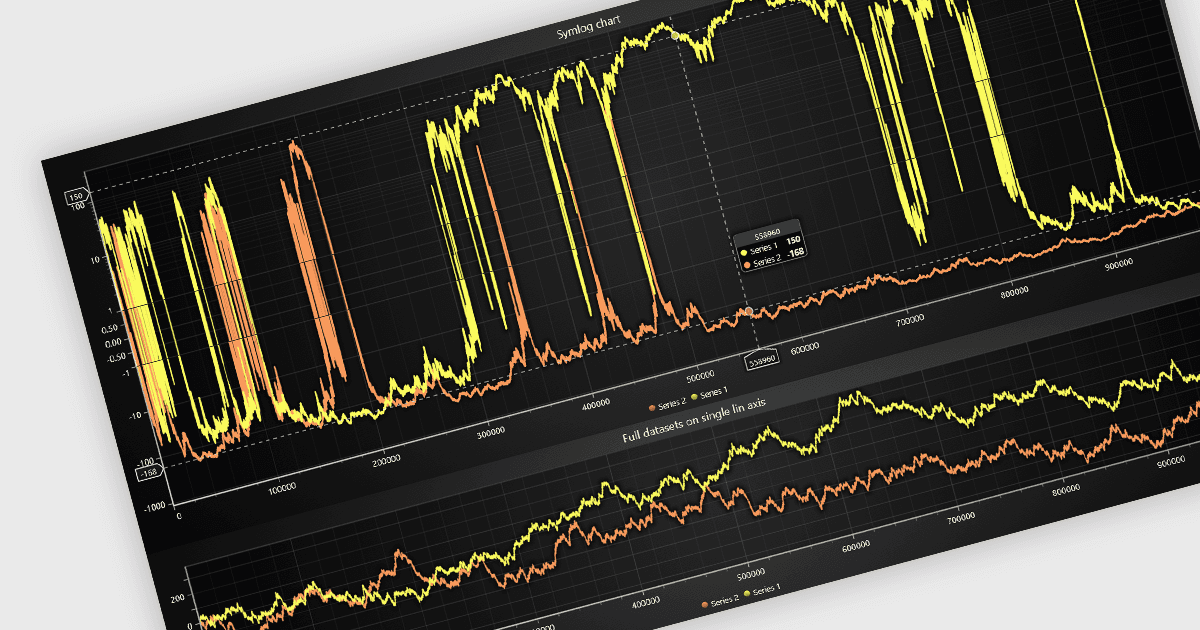
LightningChart JS v9.0 adds negative logarithmic axis support, enabling you to visualize data spanning multiple orders of magnitude on both sides of zero.
LightningChart JS is a high-performance JavaScript charting library that utilizes WebGL rendering and GPU acceleration to deliver exceptional performance for a wide range of data visualization needs. It is designed to handle large datasets and complex visualizations with ease, enabling developers to create interactive and visually appealing 2D and 3D charts. Ideal for applications demanding smooth real-time data updates, such as financial platforms, engineering tools, scientific research dashboards, and industrial monitoring systems, LightningChart JS provides a comprehensive API for customization and integration into web-based projects.
The LightningChart JS v9.0 update adds support for negative logarithmic axes, enabling developers to create symmetric logarithmic (symlog) charts for datasets that span large positive and negative magnitudes while also including values around zero. By combining negative logarithmic scaling below zero, a linear scale near zero, and positive logarithmic scaling above zero, developers can represent wide-ranging data in a single chart while accommodating values that conventional logarithmic scales cannot represent. This is particularly useful for financial analytics, chemistry, scientific visualization, and other applications where data spans several orders of magnitude on both sides of zero.
To see a full list of what's new in v9.0, see our release notes.
LightningChart JS is licensed based on method of deployment with options including Publisher, SaaS, Application Developer, and Internal Deployment. Each license is perpetual and includes 1 year subscription for technical support and software updates. See our LightningChart JS licensing page for full details.
For more information, see our LightningChart JS product page.