Build Dashboards with Drag-and-Drop
LightningChart .NET v12.6.1 adds Universal Data Parser to automatically interpret data files and present suitable visualization options in WPF applications.
LightningChart .NET is a high-performance data visualization library designed for .NET developers working with WPF, WinForms, and UWP applications. It offers GPU-accelerated rendering for smooth real-time visualization of massive datasets containing billions of data points. This library supports a wide variety of chart types, including 2D, 3D, polar, and geographic maps, along with extensive customization options for each. LightningChart .NET is a powerful tool for developers creating demanding data visualization applications requiring exceptional performance.
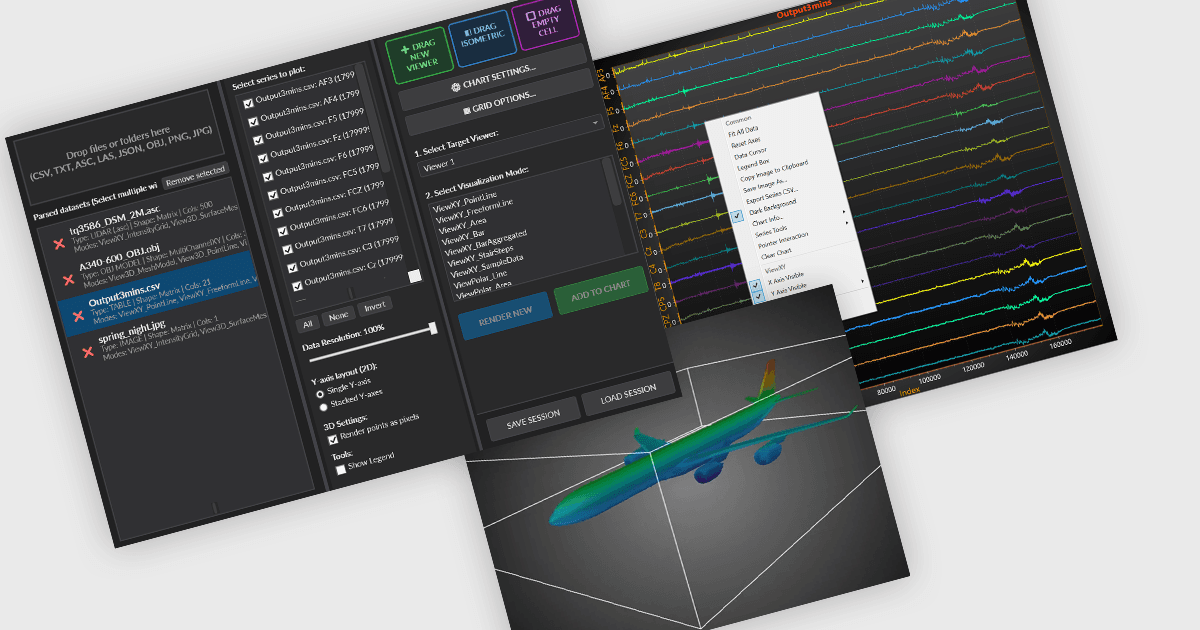
The LightningChart .NET v12.6.1 update introduces Universal Data Parser (UDP), a WPF UserControl that enables developers to create and configure data dashboards without writing code. Developers can drag and drop data files into the dashboard, where the parser automatically identifies the data structure and presents suitable visualization options. Users can then select what to visualize, choose a chart type and arrange charts within the desired dashboard layout. UDP reduces manual dashboard configuration and data-loading effort while providing high-performance visualization through LightningChart controls.
To see a full list of what's new in v12.6.1, see our release notes.
LightningChart .NET is available per developer in packages for either WPF, WinForms, UWP or all 3. Each package comes as a subscription license (with 1 or 2 years of limited support), or a perpetual license (with 1 or 2 years of Standard or Premium support). Floating licenses and site licenses are available upon request. See our LightningChart .NET licensing page for full details.
Learn more on our LightningChart .NET product page.