Export Charts to SVG in JavaScript
amCharts 5.21 adds SVG rendering and export, supporting data visualization with scalable, editable output for reports, presentations and design tools.
amCharts provides JavaScript data visualization tools for web applications through its Charts, Maps, Stock Chart and Gantt products. Developers can combine interactive charts, geographic maps, financial analysis and project timelines to present complex information in customizable interfaces built with popular frameworks, such as React, Angular, Vue.js and Svelte. These capabilities support a range of applications, including exploring regional sales performance in business dashboards, analyzing market trends in financial platforms and tracking task dependencies in planning tools.
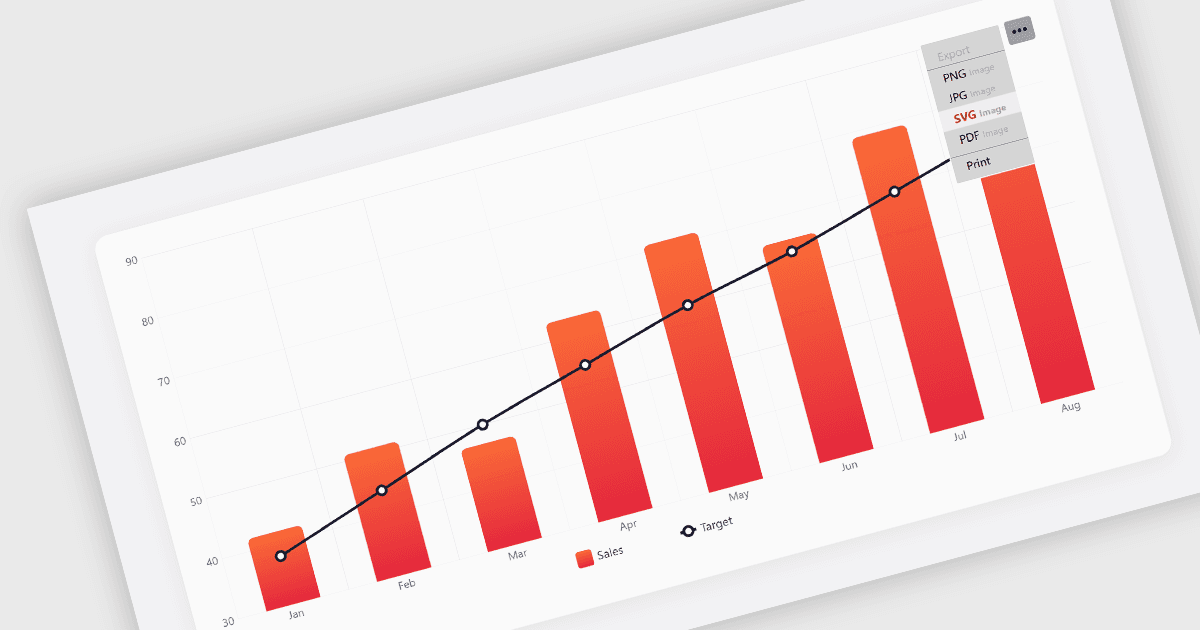
amCharts 5.21 introduces SVG rendering and export, giving developers greater flexibility in displaying and sharing visualizations. A single setting enables SVG rendering, allowing chart elements to be inspected in browser developer tools while keeping graphics sharp when enlarged. Charts can also be exported as SVG regardless of whether they use canvas or SVG rendering, with the format available in the export menu by default. Exported text remains editable in design tools such as Illustrator and Figma, helping teams reuse visualizations in reports, presentations and other published materials.
For a full list of what's new in 5.21, see our release notes.
amCharts is licensed per developer on an annual or perpetual basis, with options for websites, SaaS and OEM distribution. See our amCharts 5: Charts licensing page for full details.
To find out more, visit our amCharts 5: Charts product page.