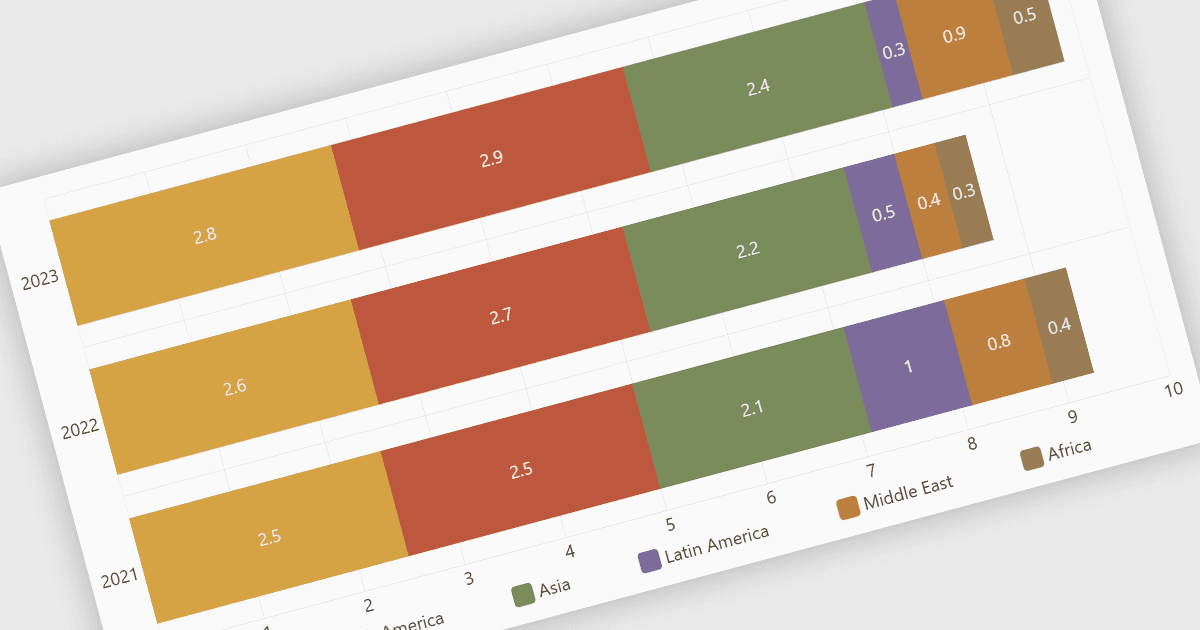
Broaden Design Options with New Colour Schemes
amCharts 5.20 adds a range of new color schemes, dark theme variants and parameterized themes, giving developers greater flexibility to customize chart visualizations.
JavaScript charting library for interactive data visualization.
Prices from:
| Available individually | Our Price |
|---|---|
| amCharts 5: Charts | Loading |
Trial version available Contact us for a free trial
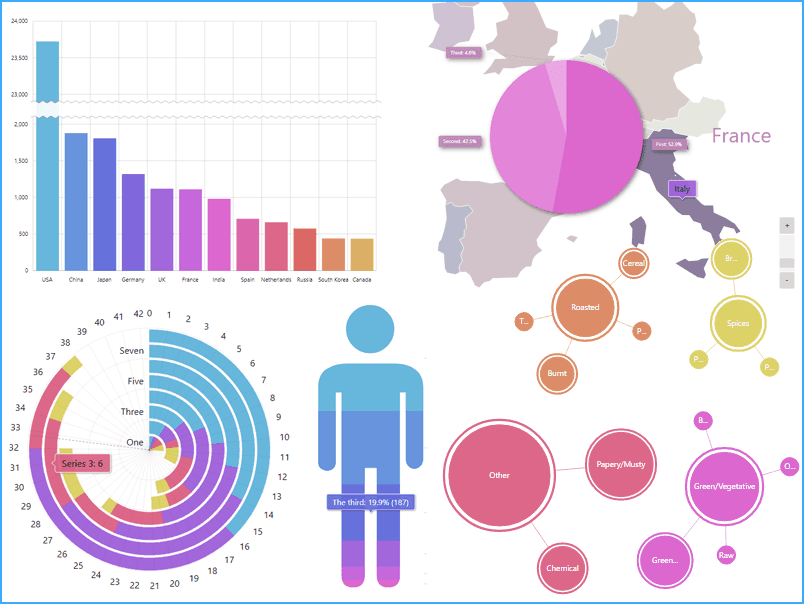
Provides a wide array of chart styles including XY charts, pie charts, funnel charts, and radar charts, catering to different data representation needs.
Enables creation of different axis types like value, date, category, and gapless date axes with customizable rendering options for precise control over data scaling and display.
Supports multiple series types such as line, column, candlestick, and smoothed series, each configurable with data fields and axis assignments to match various data structures.
Includes built-in features like legends, cursors with crosshairs, and zoom/pan controls to enhance user interaction and data exploration within charts.
Incorporates ARIA roles and screen reader labels ensuring that charts are accessible to users with disabilities, improving overall usability.
Supports setting and updating data directly on series with various formats including categorical, numerical, and date-based timestamps for dynamic visualizations.
Offers detailed settings for chart appearance such as backgrounds, colors, gradients, and filters to customize visual style and meet branding requirements.
Uses a modular import system allowing selective loading of necessary components like XY or pie chart modules, optimizing application performance and size.
Supports theming for consistent styling across charts and adapters for customizing element behavior, enabling tailored chart experiences.
Provides a rich set of methods and events to manage chart lifecycle, manipulate elements, and respond to user interactions effectively.
Review the details below to ensure this product is supported within your environment.
amCharts 5.20 adds a range of new color schemes, dark theme variants and parameterized themes, giving developers greater flexibility to customize chart visualizations.
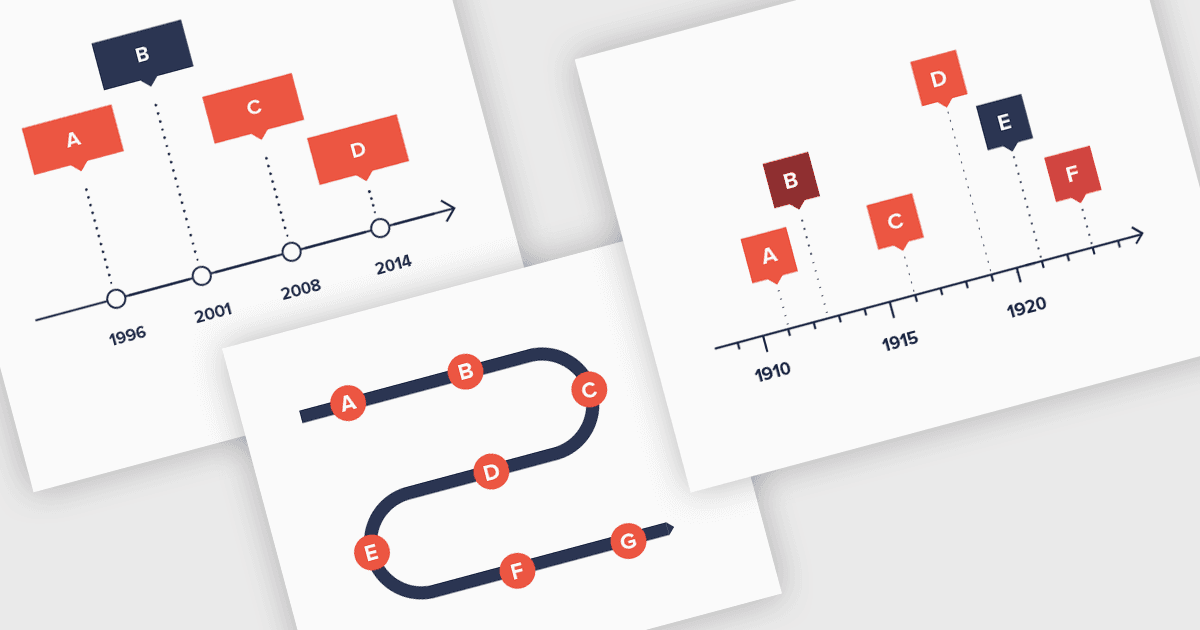
amCharts 5 adds a distinctive Timeline chart for space-efficient and visually interesting linear data representation using serpentine and spiral layouts.
amCharts, founded in 2006, is a leading creator of JavaScript charting libraries based in Lithuania. Its main library, amCharts 5, is actively developed and widely integrated with TypeScript, React, Angular, Vue, and plain JavaScript environments. amCharts libraries allow developers to build modern, customizable, and high-performance data visualizations including charts, maps, and infographics. With a focus on efficient rendering using the Canvas API, accessibility, and flexible theming, amCharts offers straightforward licensing and architecture that supports diverse visualization needs for web dashboards and interactive analytics.

As official and authorized distributors since 2019, ComponentSource supplies you with legitimate licenses directly from amCharts.