 Data Aggregation
 Drill Down
 Export to HTML
 Annotations
 Export to Image
 Export to PDF
 Export to SVG
 Export to XLS/XLSX
 Live Data
 Printing
 Responsive
 Export to CSV
 Themes
 Zooming
 Show/Hide Series
 Scrolling
 Tooltips
 Trend Lines
 Animation
 Column & Bar Charts
 Combination Charts
 Gantt Charts
 Heat & Tree Maps
 Line Charts
 Funnel Charts
 Pie Charts
 Pyramid Charts
 Radar & Polar Charts
 Radial Charts
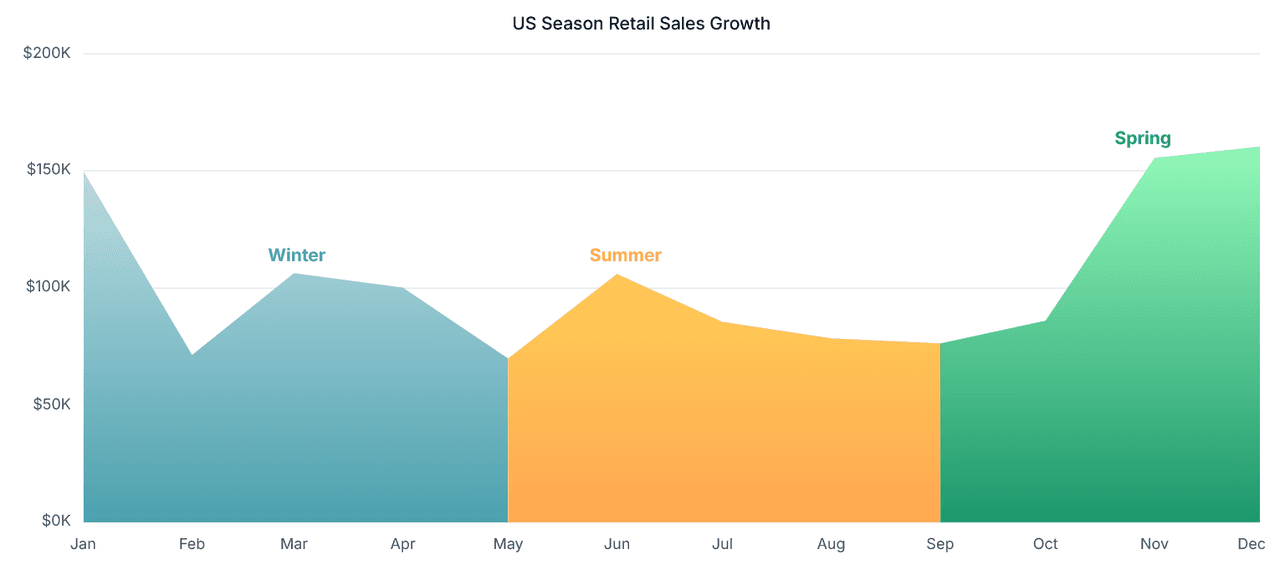
 Area Charts
 Bullet Charts
 Surface Charts
 Scatter & Bubble Charts
 3D Charts
 Sparklines
 Candlestick Charts
 Indicators
 Kagi Charts
 OHLC / HLOC Charts
 Point and Figure Charts
 Range Charts
 Renko Charts
 Spline Charts
 Step Line Charts
.svg) Box Plots
Box Plots High Contrast Support
 Keyboard Navigation Support
 EN 301 549 Compliant
 Tactile SVG Export
 WCAG 2.0 Compliant
 WCAG 2.1 Compliant
 Screen Reader Support
 Section 508 Compliant
 Sonification Support
 Voice Input Support
 Google Sheets
 HTML Table
 JSON
JSON CSV
CSV JavaScript API
 XML
XML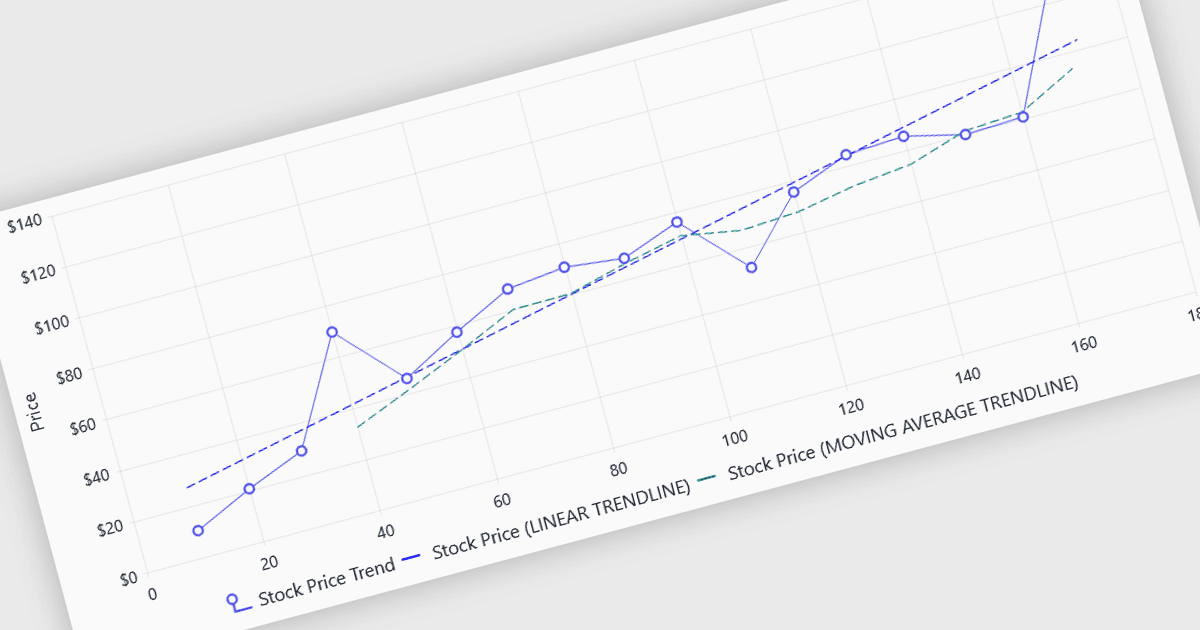
Analyze Data Trends Over Time
Visualize underlying patterns with chart trendlines to clarify data direction, reduce the impact of fluctuations, and support informed decision-making.
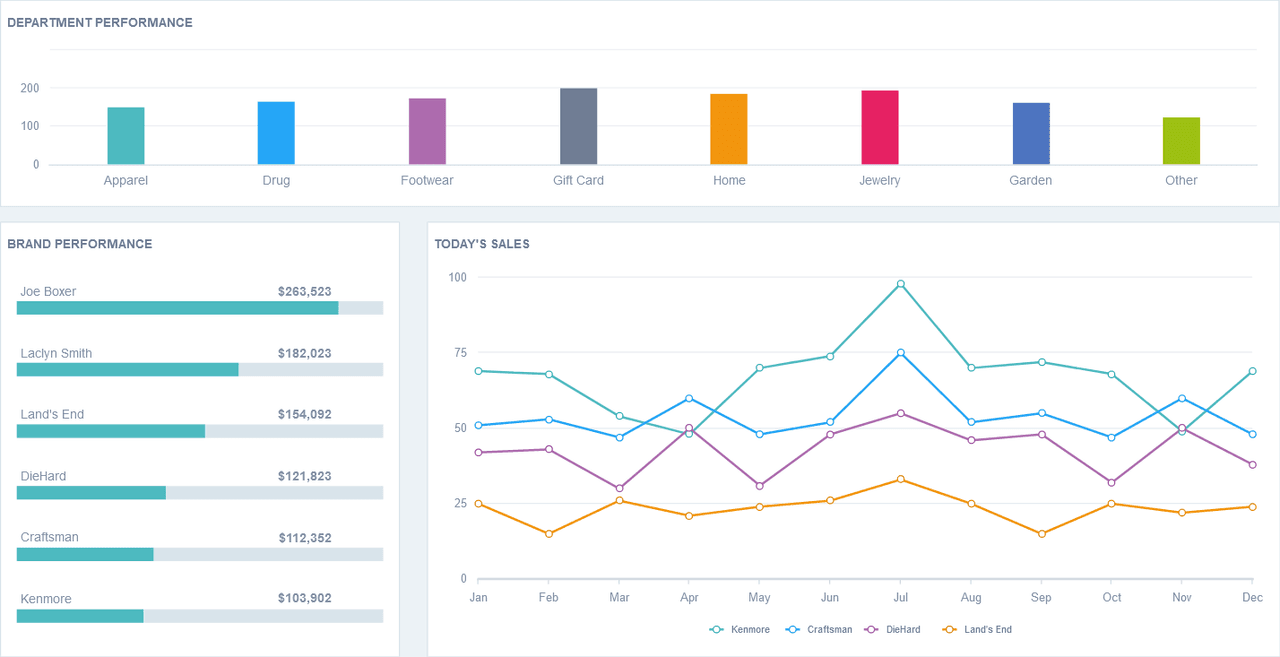
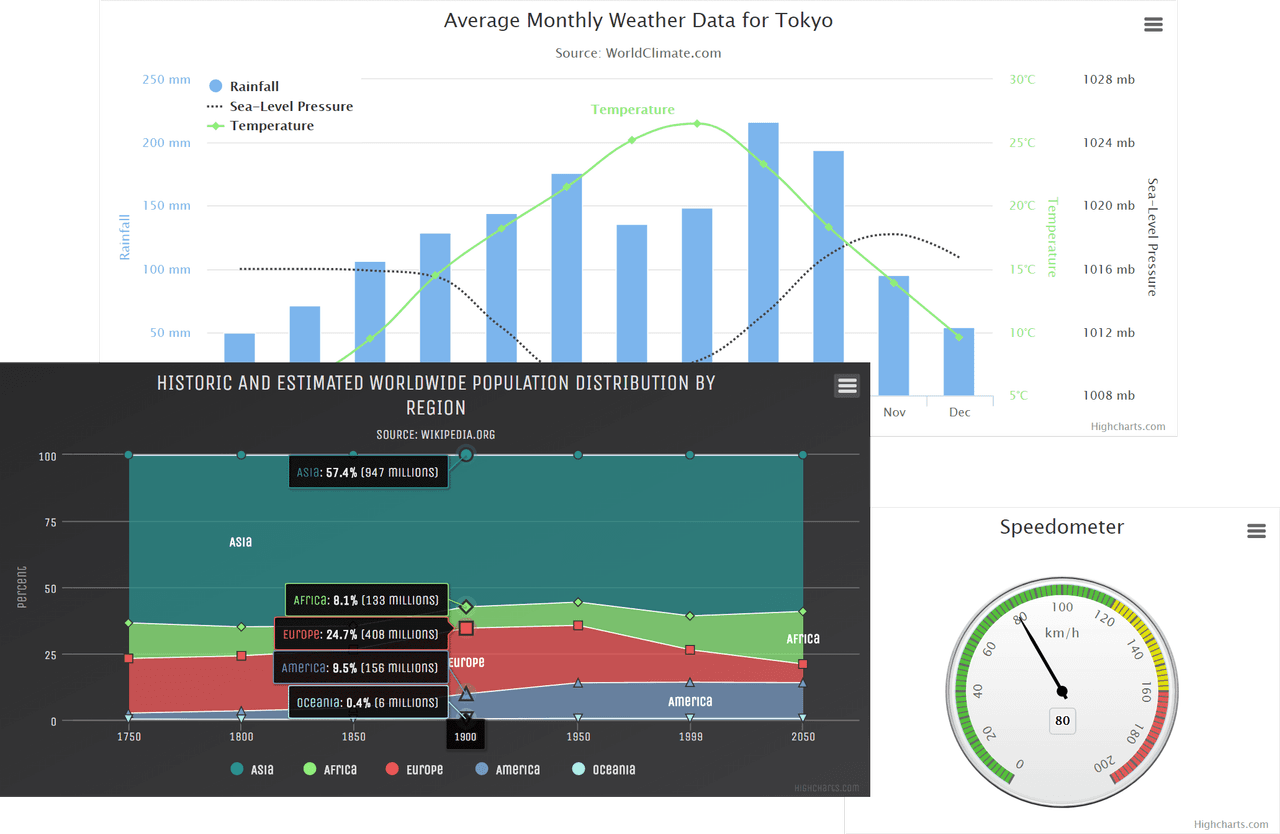
Visualize complex data effortlessly and enhance decision-making with dynamic graphical representations.
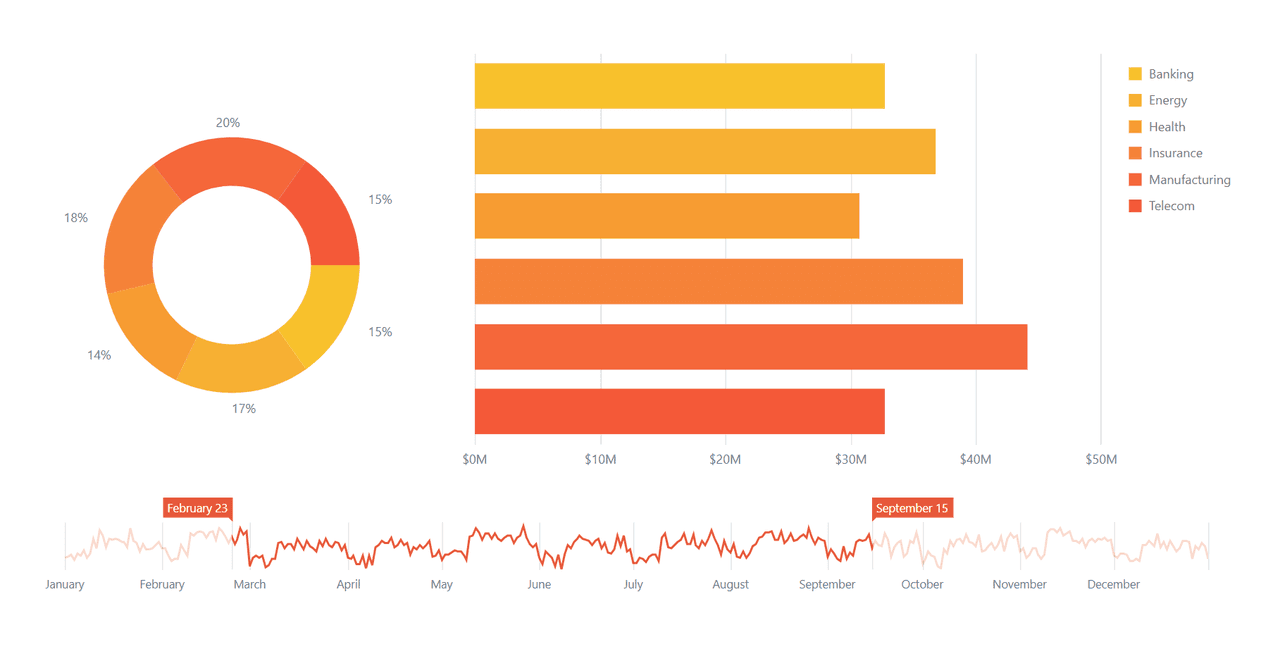
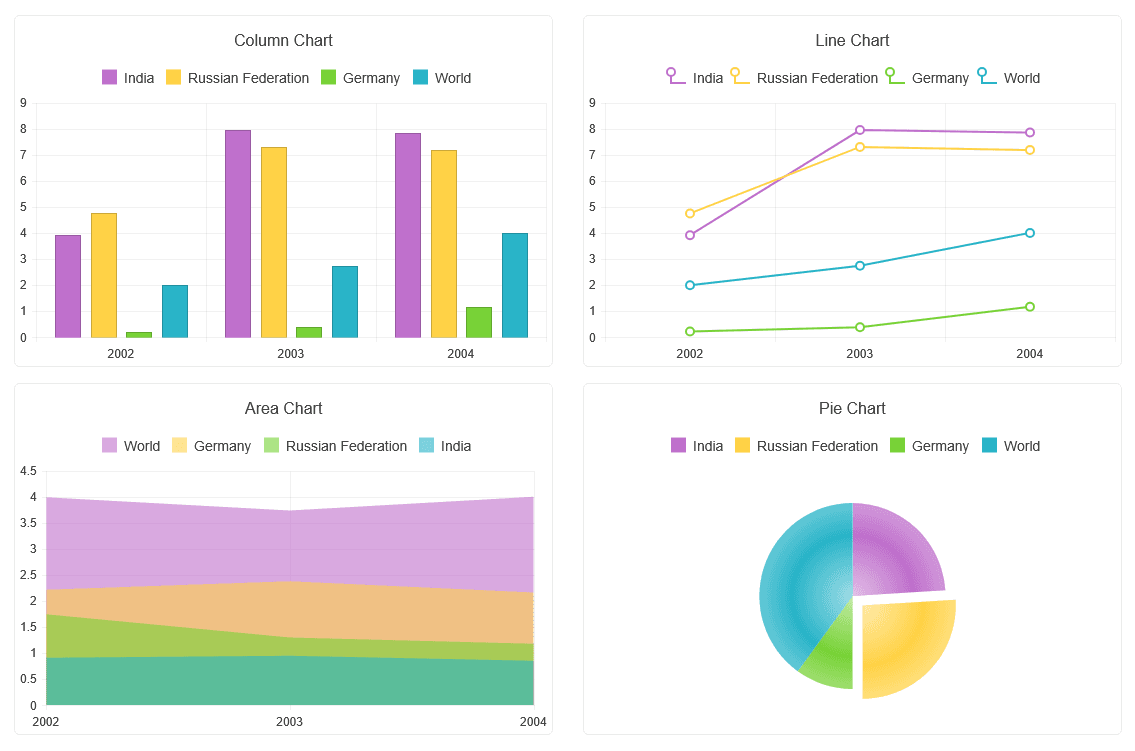
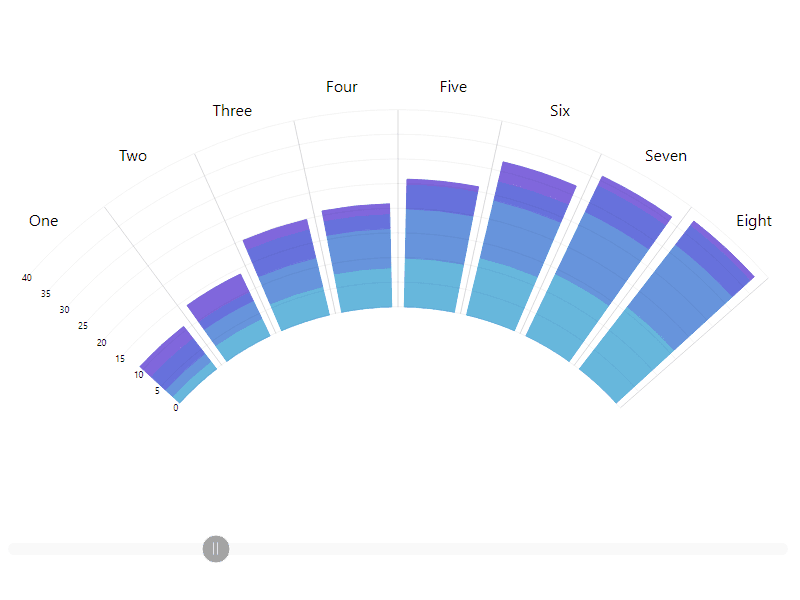
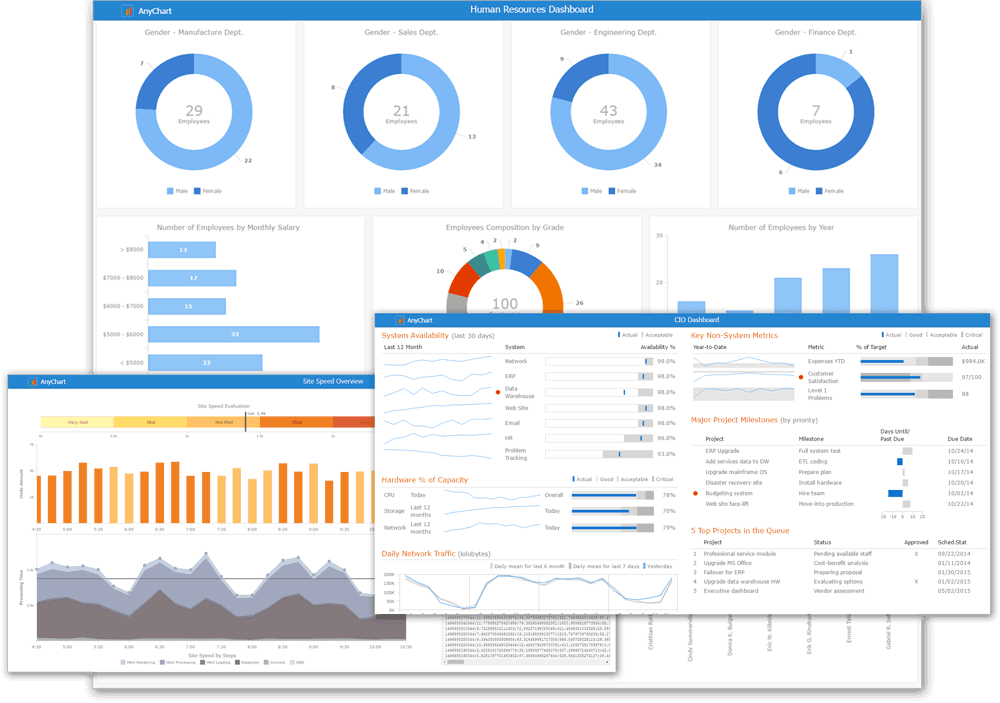
Chart controls provide developers with tools to create interactive charts, graphs, and dashboards within software applications. These libraries and components, often known as data visualization controls, enable users to display data through bar charts, line graphs, pie charts, heat maps, and more. Key features include customizable chart types, responsive layouts, real-time data updates, and export functionality. Developers use chart controls to build visually engaging analytics modules, interpret trends, and improve reporting interfaces. They aid in simplifying large datasets, supporting applications in fields like business intelligence (BI), finance, and scientific research where clear data representation is essential for insights and decision-making.

Browse publishers offering Chart Controls solutions across a wide range of platforms and project requirements.

















Browse Chart Controls by platform to find options that fit your project requirements.






















































Visualize complex data effortlessly and enhance decision-making with dynamic graphical representations.
Visualize underlying patterns with chart trendlines to clarify data direction, reduce the impact of fluctuations, and support informed decision-making.
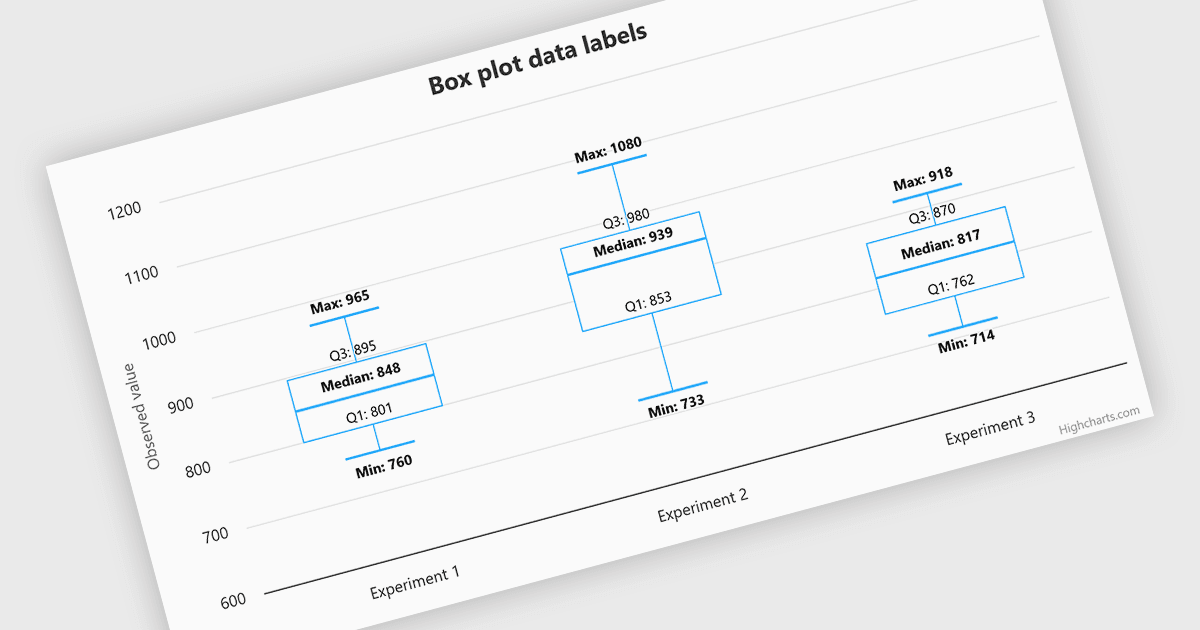
Highcharts v13 improves the readability of box plot charts by aligning data labels with minimum, maximum, median, and quartile values.
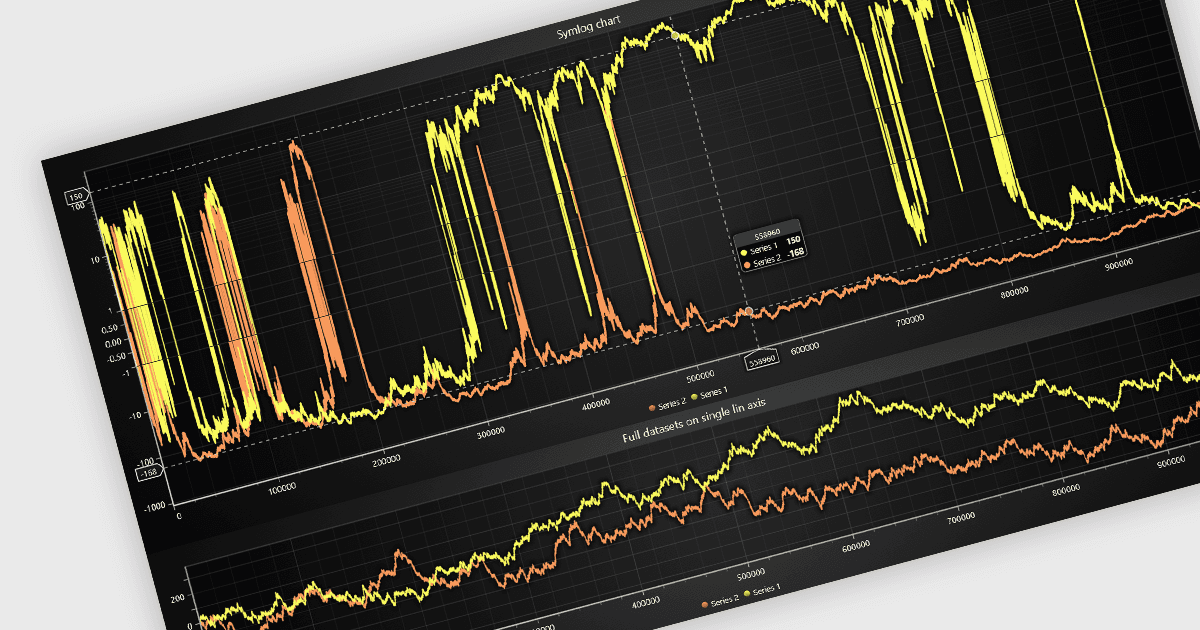
LightningChart JS v9.0 adds negative logarithmic axis support, enabling you to visualize data spanning multiple orders of magnitude on both sides of zero.
Our product experts can help you narrow down the category and identify options that fit your platform, requirements and budget.