Visualize Connections with Dependency Wheels
AnyChart JS 9.0.0 adds dependency wheels to visualize weighted connections and highlight key relationships.
AnyChart JS is a JavaScript charting library for adding interactive data visualizations to web, desktop and mobile applications. Developers can customize chart appearance, configure themes and annotations, and present data using a wide range of chart types.
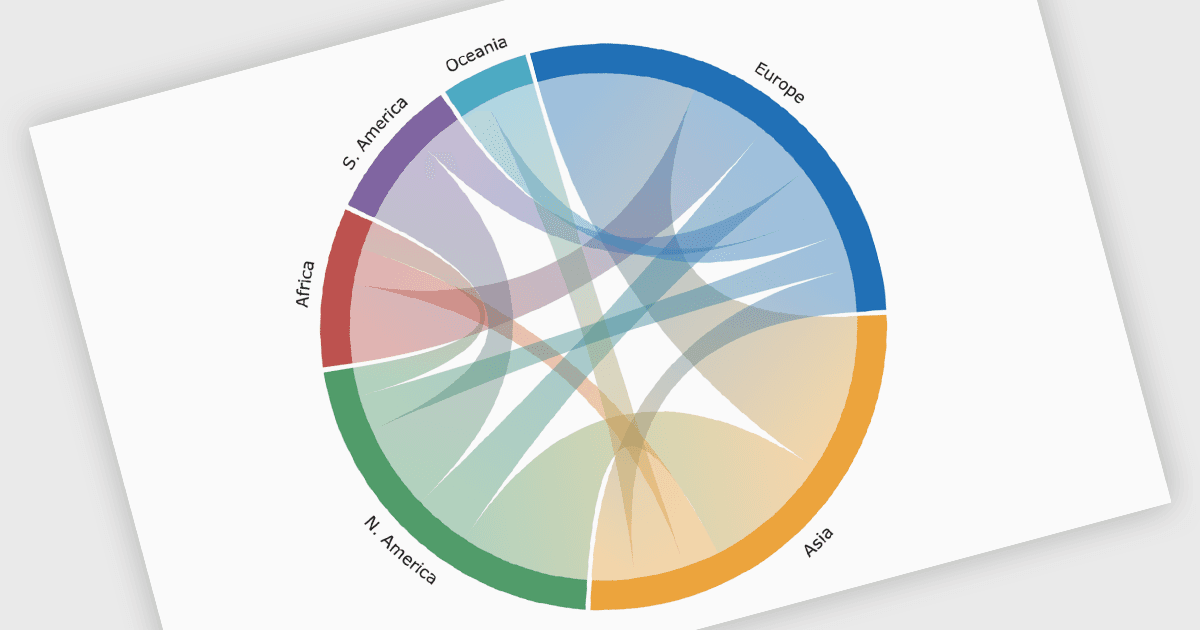
AnyChart JS 9.0.0 introduces dependency wheels, also known as chord diagrams, for displaying weighted relationships. Nodes sit around a circle, while connecting ribbons vary in width according to the flow between them. This gives developers a compact way to present interconnected data, helping users identify dominant connections in their data.
For a full list of what's new in 9.0.0, see our release notes.
AnyChart JS offers a range of Annual and Perpetual licensing options including Website, Internal, Saas, Enterprise, OEM, and Next Unicorn Licenses. See our AnyChart JS licensing page for full details.
For more information, visit our AnyChart JS product page.