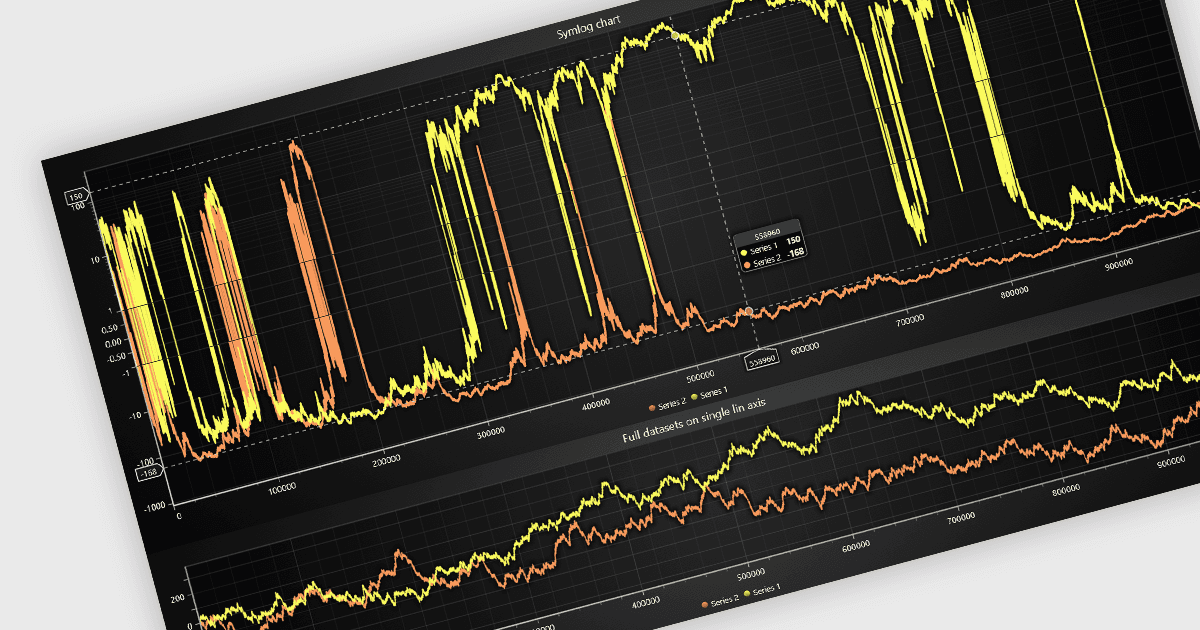
Visualize Data Across Orders of Magnitude
LightningChart JS v9.0 adds negative logarithmic axis support, enabling you to visualize data spanning multiple orders of magnitude on both sides of zero.
High-performance data visualization components designed for real-time and demanding applications across web, desktop, and cloud platforms.
LightningChart, founded in Finland, specializes in advanced data visualization libraries for developers and IT professionals. Since its inception, LightningChart has focused on delivering GPU-accelerated charting components for .NET, JavaScript, and Python, supporting web, desktop, server, and IoT environments. Its libraries are known for rapid rendering and the ability to handle massive datasets, making them popular in scientific, engineering, financial, and medical software. With a dedicated team and worldwide presence, LightningChart offers customizable visualization solutions that help users achieve exceptional performance and flexibility in modern application development.

As official and authorized distributors since 2021, ComponentSource supplies you with legitimate licenses directly from LightningChart.
Develop high-performance, GPU-accelerated 2D and 3D JavaScript charts.
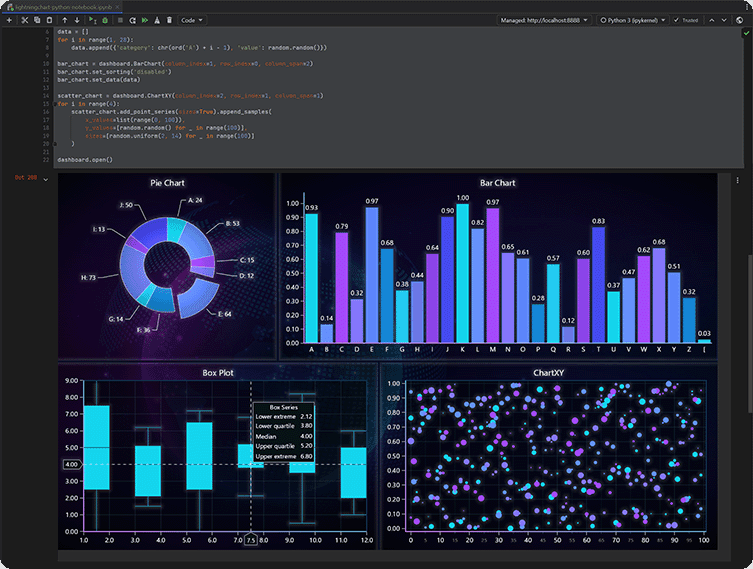
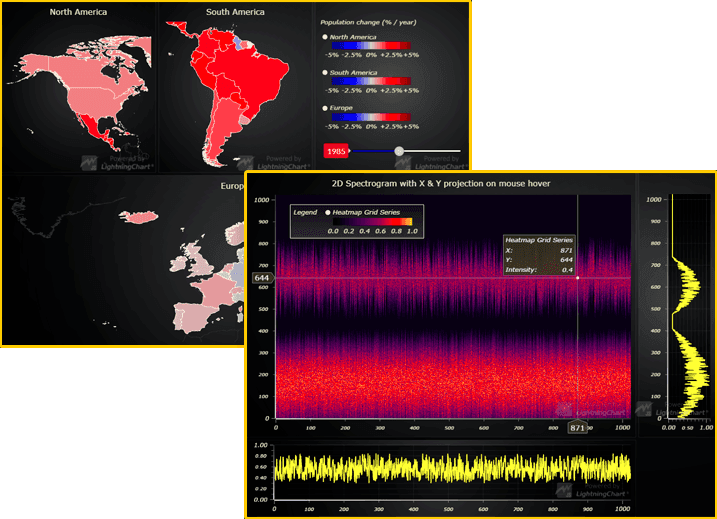
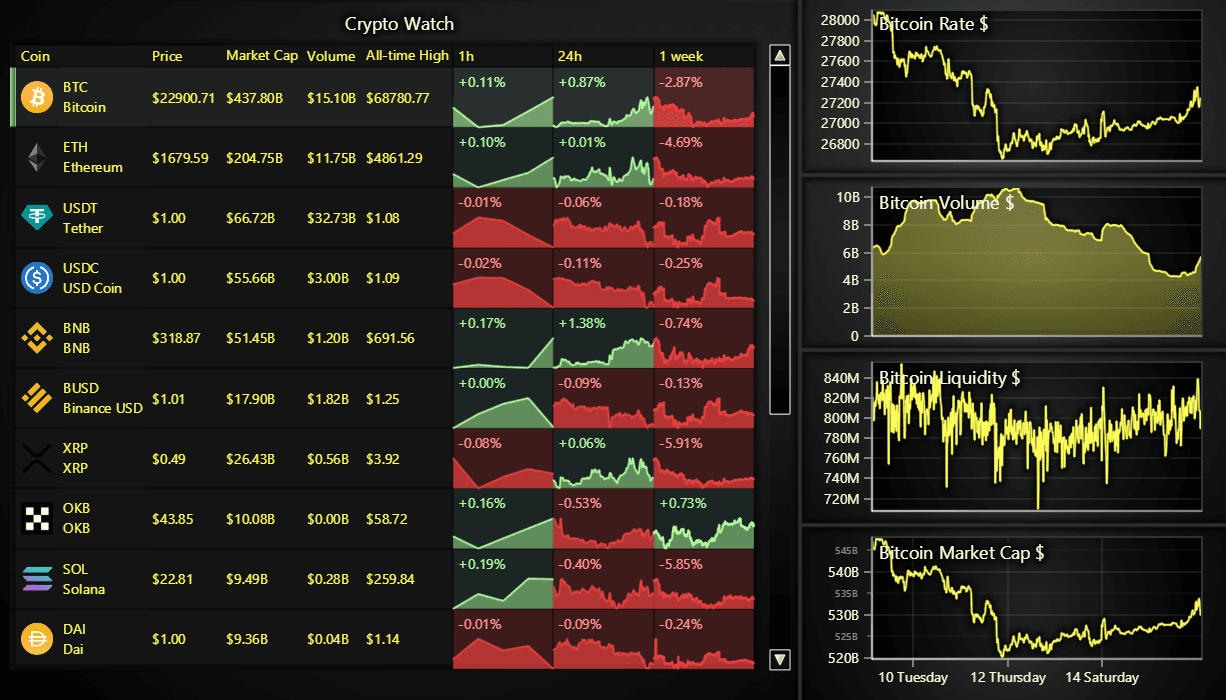
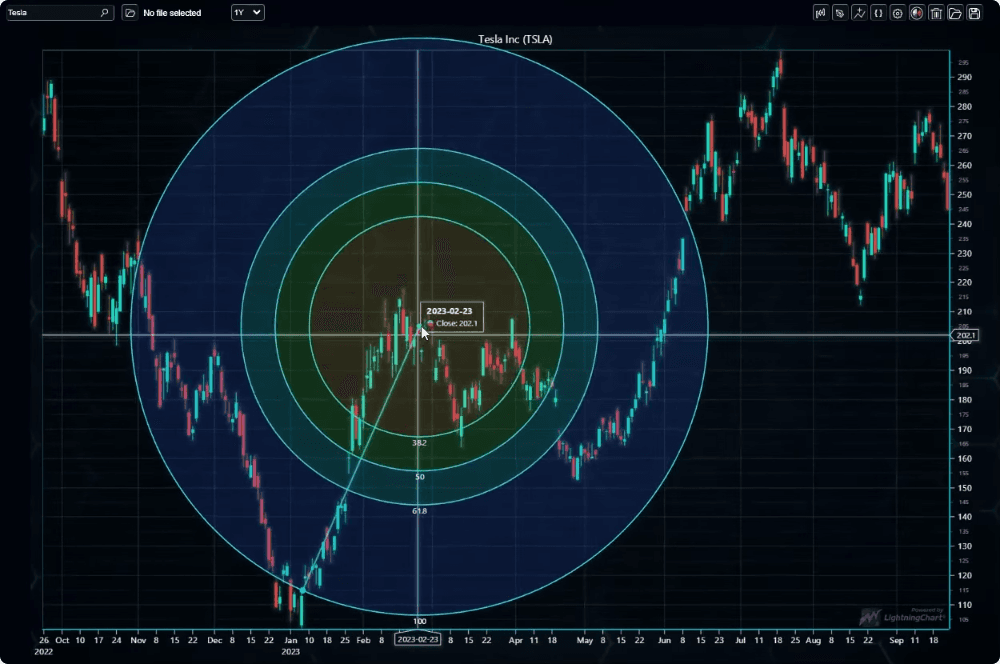
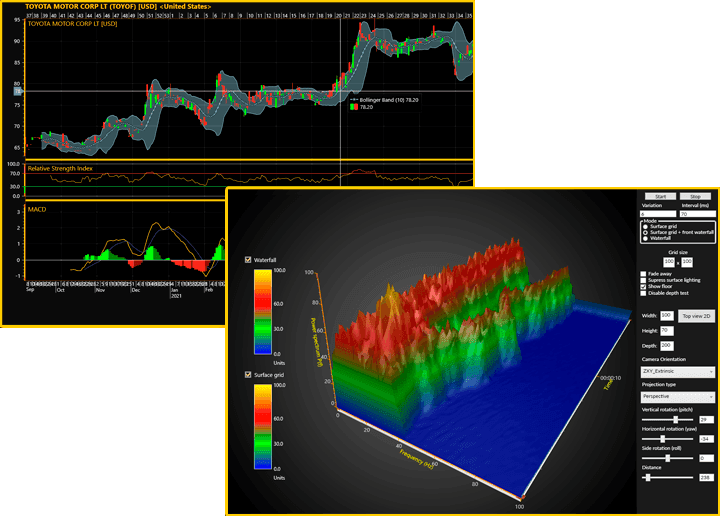
Explore LightningChart products by category.

Craft engaging, interactive user experiences with components and visual controls for building modern, data-rich applications.
Craft engaging, interactive user experiences with components and visual controls for building modern, data-rich applications.
Find the right product for your development platform.











Stay up to date with the latest LightningChart product releases, feature updates and developer resources.
LightningChart JS v9.0 adds negative logarithmic axis support, enabling you to visualize data spanning multiple orders of magnitude on both sides of zero.

ComponentSource has awarded LightningChart a Top 100 Publisher Award in the annual ComponentSource Awards for 2026.
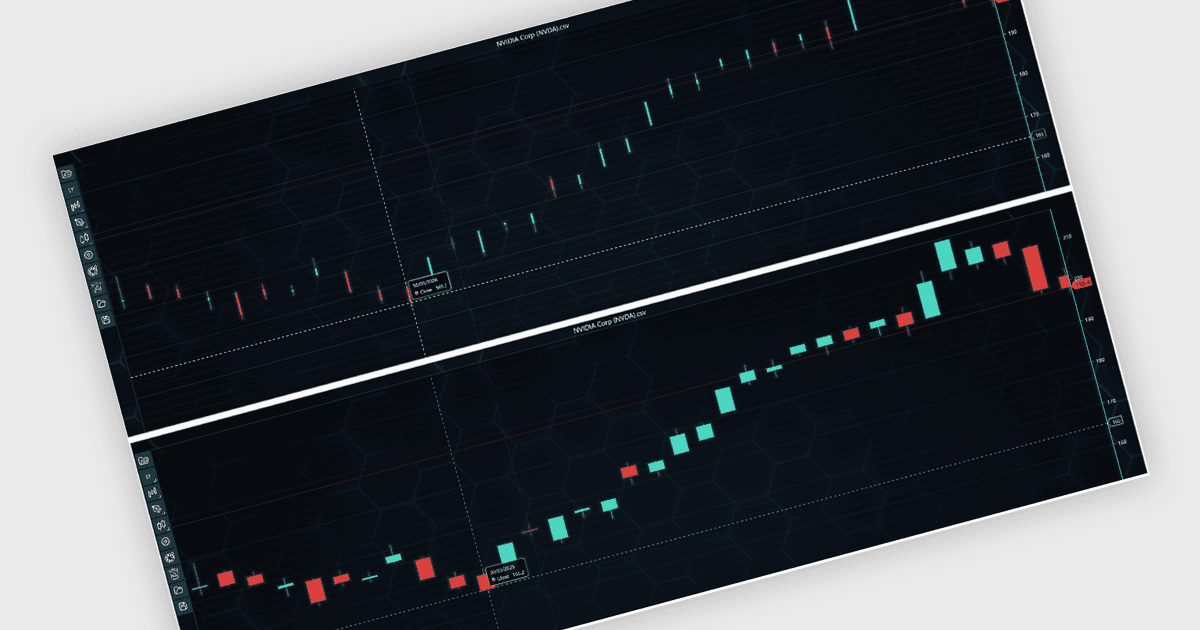
LightningChart JS Trader offers automatic candlestick and bar width scaling to improve chart readability and maximize data visibility during zooming.
Our product experts can help you find the right LightningChart product for your platform, team size and project requirements.