


Official Supplier
As official and authorized distributors, we supply you with legitimate licenses directly from 200+ software publishers.
See all our Brands.
amCharts: Charts is a versatile and user-friendly JavaScript library designed for seamless data visualization across a wide range of applications. This ready-made solution helps users to integrate interactive charts without the need to learn complex new technologies. Featuring built-in support for TypeScript and ES6 modules, amCharts: Charts offers full compatibility with popular front-end frameworks such as Angular, React, and Vue.js. Its flexibility and ease of use make it an ideal choice for developers seeking a powerful yet simple drop-in solution to create engaging and informative data visualizations for dashboards and data analytics.
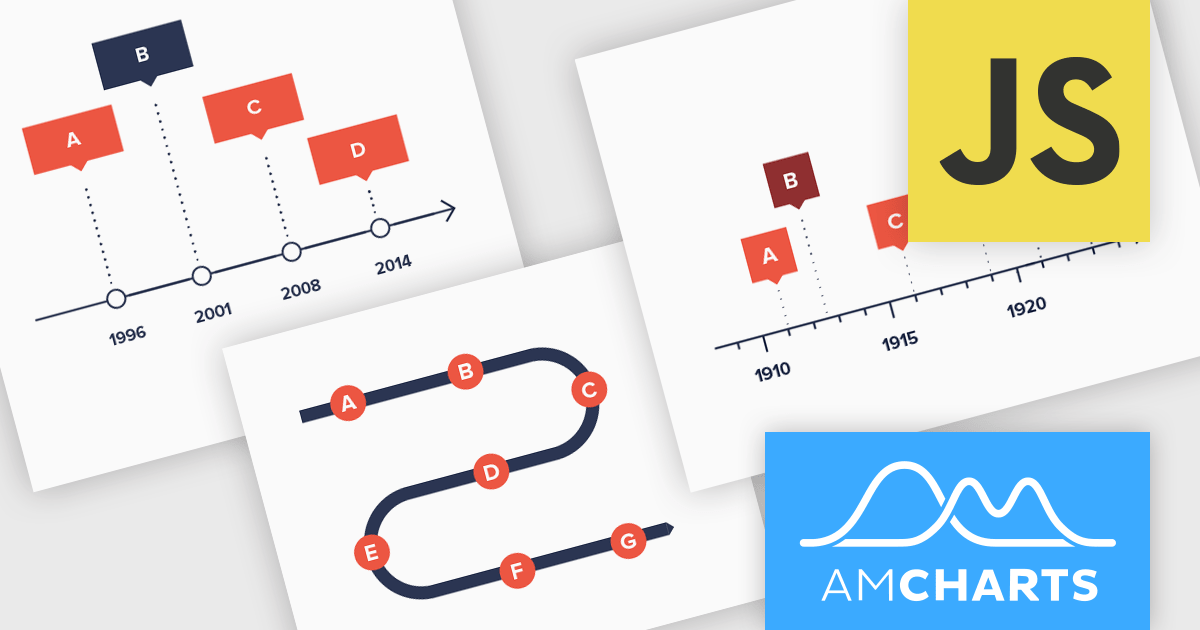
The amCharts 5.12.0 update introduces a new Timeline chart type, providing developers with a specialized component for visualizing linear datasets in a space-efficient manner. This chart facilitates the creation of two-dimensional plots that can be rendered along serpentine, spiral, or fully customized paths. By deviating from traditional linear axes, the Timeline chart offers a unique approach to presenting chronological or sequential data, potentially enhancing user engagement and providing alternative perspectives on data distribution without requiring complex configurations beyond standard XY chart principles. This new chart type inherits core functionalities from existing XY charts, ensuring a familiar development experience while offering a distinct visual representation option.
To see a full list of what's new in amCharts 5: Charts (version 5.12.0), see our release notes.
amCharts is licensed per developer on an annual or perpetual basis, with options for websites, SaaS and OEM distribution. See our amCharts 5: Charts licensing page for full details.
For more information, visit our amCharts 5: Charts product page.


Tel: (888) 850 9911
Fax: +1 770 250 6199


