Add Financial Indicators to MFC Charts
Codejock Toolkit Pro 26.0.0 adds built-in financial chart functions, helping developers display moving averages, RSI and Bollinger Bands.
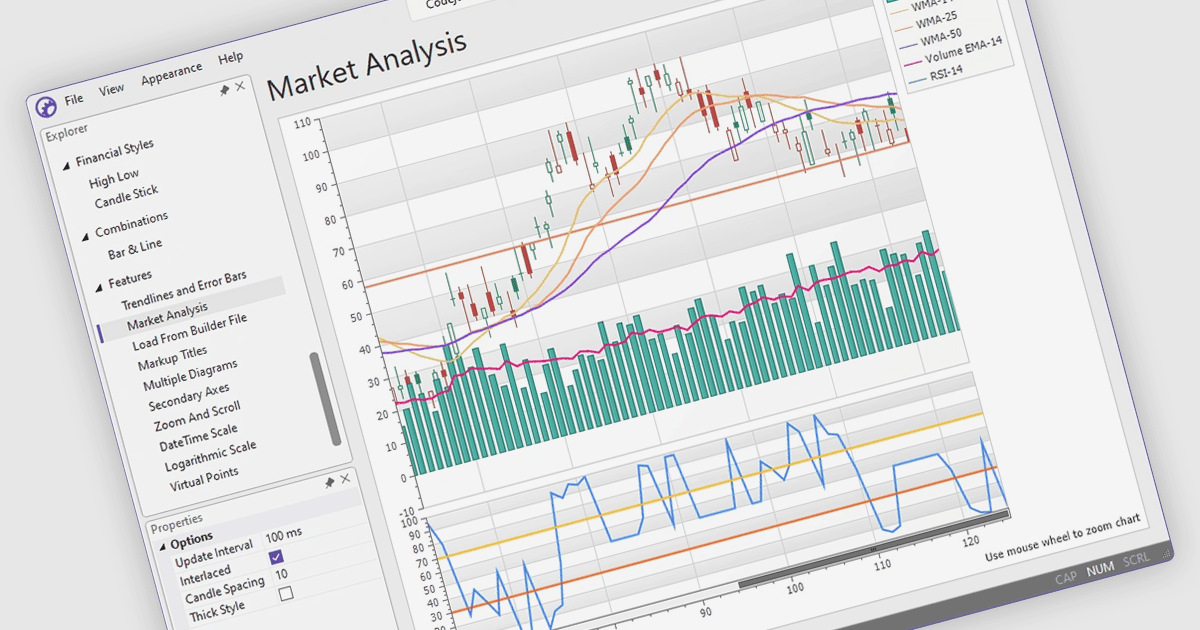
Codejock Toolkit Pro is a collection of user interface components for building Windows desktop applications with Visual C++ and MFC. It includes charts, grids, calendars, ribbons, docking panes and other controls for creating application interfaces.
The Codejock Toolkit Pro 26.0.0 release expands its built-in chart series function library with Simple Moving Average (SMA), Exponential Moving Average (EMA), Weighted Moving Average (WMA), Relative Strength Index (RSI), Shift and Bollinger Bands. These functions help developers add financial indicators to charts without implementing each calculation from scratch. Moving averages help reveal trends, while RSI and Bollinger Bands support analysis of momentum and volatility. Series computations can also be chained using another series' computed values, supporting related calculations within the same chart.
To see a full list of what's new in the 26.0.0 release, see our release notes.
Codejock Toolkit Pro is licensed per developer and is available as a perpetual license with 30 days or 1 year subscription (product updates and phone/email technical support). See our Codejock Toolkit Pro licensing page for full details.
For more information, visit our Codejock Toolkit Pro product page.