dotMemory
Efficiently analyze and optimize .NET application memory usage.
- Profiles memory for .NET Framework, .NET Core, and more.
- Provides detailed snapshots and timeline views for analysis.
- Integrates with Visual Studio and JetBrains Rider.

Prices from:
| Available in | |
|---|---|
| JetBrains All Products Pack | Loading |
| dotUltimate | Loading |
Support for Various .NET Applications
Profiles applications based on any supported .NET Framework, .NET Core, ASP.NET, IIS and Windows services, including integration with JetBrains Rider on macOS and Linux.
Raw Memory Dumps Import
Imports and analyzes raw Windows and Linux memory dumps as snapshots, enabling automatic inspections and retention diagram analysis.
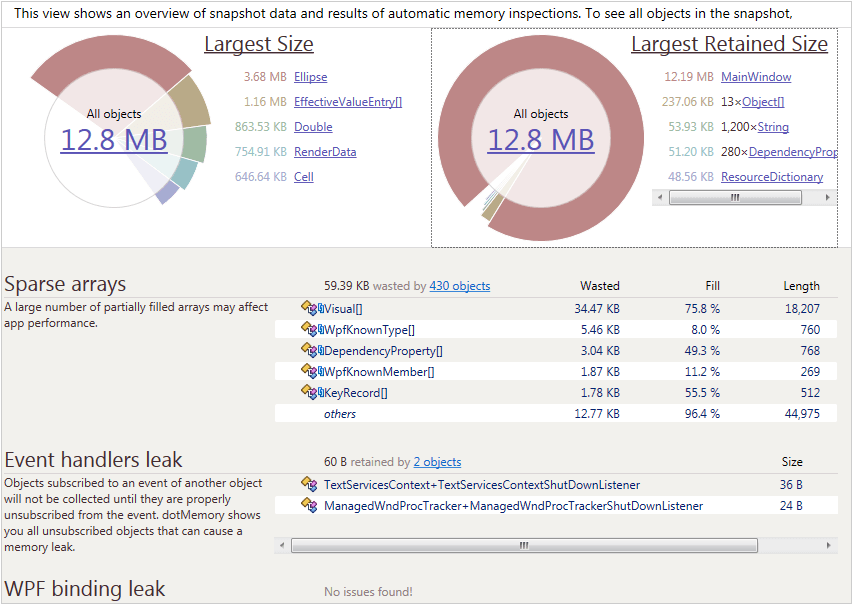
Sunburst and Icicle Diagrams
Visualizes memory retention hierarchies with sunburst and icicle charts, highlighting large memory consumers and enabling detailed investigations by zooming into dominators.
Integration with Visual Studio and Rider
Allows launching profiling sessions, tracking allocations in real time, and navigating from memory objects directly to type declarations within Visual Studio and JetBrains Rider.
Automatic Snapshot Triggers
Automates memory snapshot collection based on user-defined conditions, useful for capturing snapshots during specific memory usage spikes or complex profiling scenarios.
Timeline View with Real-Time Collection
Monitors memory consumption over time with an interactive timeline, enabling snapshot capture and easy comparisons between memory states.
Comprehensive Data Views
Examines object heaps from multiple perspectives, including object references, call stacks, and creation paths, to assist in detailed memory behavior analysis.
Memory Snapshot Comparison
Compares two memory snapshots to identify objects responsible for memory leaks by revealing creation and collection changes between snapshots.
User-Friendly Interface
Features an intuitive navigation flow from object sets to individual instances, making memory profiling accessible and straightforward without sacrificing depth.
Memory Traffic Analysis
Analyzes allocation and garbage collection intensity, showing which objects and functions contribute most to memory traffic and potential overhead.
Product Compatibility
Review the details below to ensure this product is supported within your environment.
Host Application
- Visual Studio
How to Buy
dotMemory is available to buy as part of dotUltimate or JetBrains All Products Pack.

- dotUltimate Products
- IncludeddotCover
- IncludeddotMemory
- IncludeddotTrace
- IncludedJetBrains AI Assistant - AI Pro
- IncludedReSharper
- IncludedRider
- Additional Products
- Not includedClion
- Not includedDataGrip
- Not includedGoLand
- Not includedIntelliJ IDEA
- Not includedPhpStorm
- Not includedPyCharm
- Not includedRubyMine
- Not includedRustRover
- Not includedWebStorm

- dotUltimate Products
- IncludeddotCover
- IncludeddotMemory
- IncludeddotTrace
- IncludedJetBrains AI Assistant - AI Pro
- IncludedReSharper
- IncludedRider
- Additional Products
- IncludedClion
- IncludedDataGrip
- IncludedGoLand
- IncludedIntelliJ IDEA
- IncludedPhpStorm
- IncludedPyCharm
- IncludedRubyMine
- IncludedRustRover
- IncludedWebStorm
About JetBrains
JetBrains, founded in 2000 and headquartered in Prague, Czech Republic, is a globally respected software company founded by expert developers with deep roots in programming language research and developer tooling. Backed by decades of hands-on experience and world-class engineering talent, JetBrains builds products that reflect a deep understanding of how developers work, making them trusted by millions of professionals worldwide for their quality, precision, and innovation.

As official and authorized distributors since 2007, ComponentSource supplies you with legitimate licenses directly from JetBrains.