Infragistics Ignite UI for Angular Pivot Grid
Configure dynamic, multi-dimensional pivot tables for complex data analysis.
- Reorganize and summarize data using a flexible pivot table framework.
- Customize rows, columns, values, and filters with hierarchical dimensions.
- Support advanced features like sorting, filtering, resizing, and remote operation.

Prices from:
| Available in | |
|---|---|
| Infragistics Ignite UI for Angular | Loading |
| Infragistics Ignite UI | Loading |
| Infragistics Professional | Loading |
| Infragistics Ultimate | Loading |
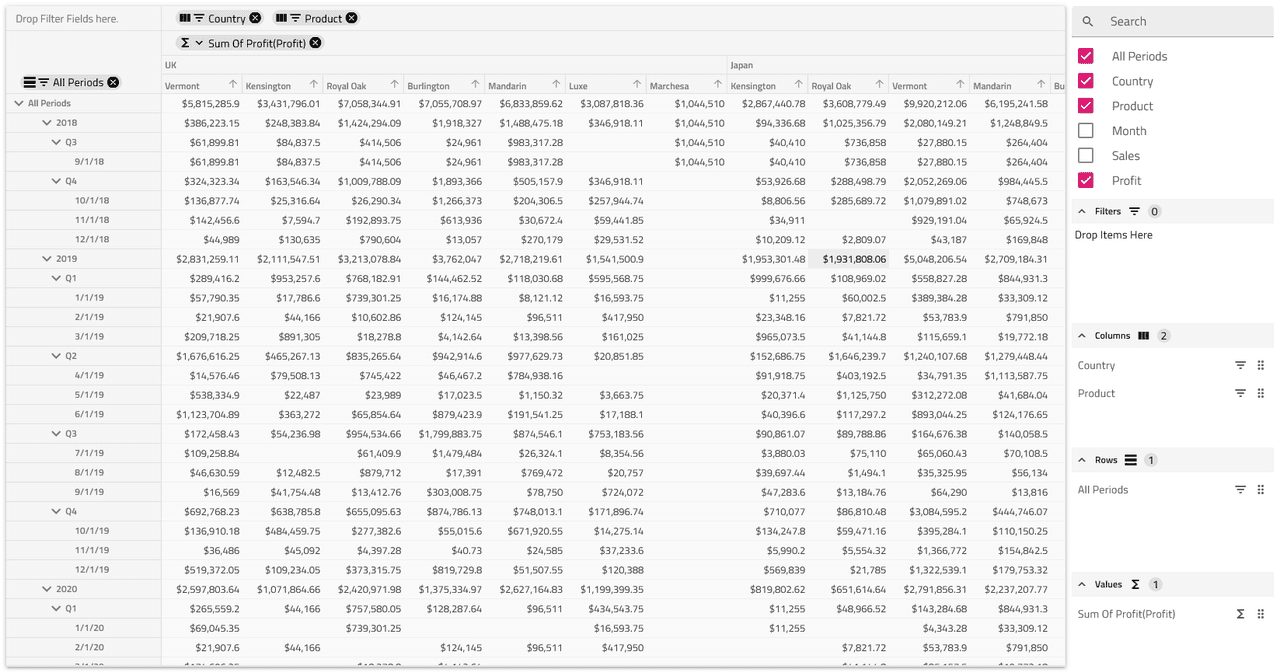
Multi-Dimensional Pivot Table Structure
The component renders data in a pivot table format, allowing organization of data into distinct row and column groups with aggregated values for efficient analysis of complex datasets.
Flexible Dimensions Configuration
Rows, columns, and filters can be defined using member names or custom functions, supporting multiple nested levels and hierarchical child levels for expanded data granularity.
Aggregation and Values Setup
Values can be configured with predefined aggregations like sum, average, min, max, count, or customized aggregation functions to calculate sums or other metrics dynamically.
Hierarchical Date Dimensions
A dedicated date dimension supports hierarchical grouping by period, year, quarter, month, and full date, enabling intuitive time-based data analysis.
Interactive Filtering and Sorting
Dimensions feature built-in UI for Excel-style filtering and sorting through chips that allow quick data subset selection and order adjustments for rows and columns.
Drag and Drop Dimension Reordering
Users can rearrange dimension chips across rows, columns, and filters areas with drag-and-drop, enhancing the pivot table's configurability during runtime.
Support for Remote and Pre-Aggregated Data
The pivot grid can bypass client-side data processing when provided pre-aggregated data or remote operation strategies, enabling efficient handling of large datasets from server sources.
Layout and Display Options
Row dimensions support vertical or horizontal layouts with options for summary columns, expandable hierarchies, custom widths, and a super compact mode for dense data visualization.
Product Compatibility
Review the details below to ensure this product is supported within your environment.
Component Type
- JavaScript
JavaScript Platform
- Angular
- Vanilla JavaScript
About Infragistics
Infragistics, founded in 1989 and headquartered in Cranbury, New Jersey, has established itself as a global force in UI/UX development, serving software professionals in over 100 countries. It is widely recognized for its comprehensive libraries and frameworks supporting web, desktop, and mobile platforms, including solutions tailored for .NET, Angular, React, and other leading technologies. With offices spanning Europe, Asia, and South America, Infragistics delivers components that enable efficient application development and rich user experiences. Its commitment to innovation and customer satisfaction positions it as a trusted partner for developers and organizations worldwide seeking quality and flexibility in their digital projects.

As official and authorized distributors since 1996, ComponentSource supplies you with legitimate licenses directly from Infragistics.