Infragistics Ignite UI for Web Components Pivot Grid
Analyze and summarize multidimensional data in interactive pivot tables.
- Presents large datasets in cross-tabular pivot table format.
- Enables data grouping, sorting, filtering, and aggregation.
- Supports drag-and-drop layout customization for end-users.

Prices from:
| Available in | |
|---|---|
| Infragistics Ignite UI | Loading |
| Infragistics Professional | Loading |
| Infragistics Ultimate | Loading |
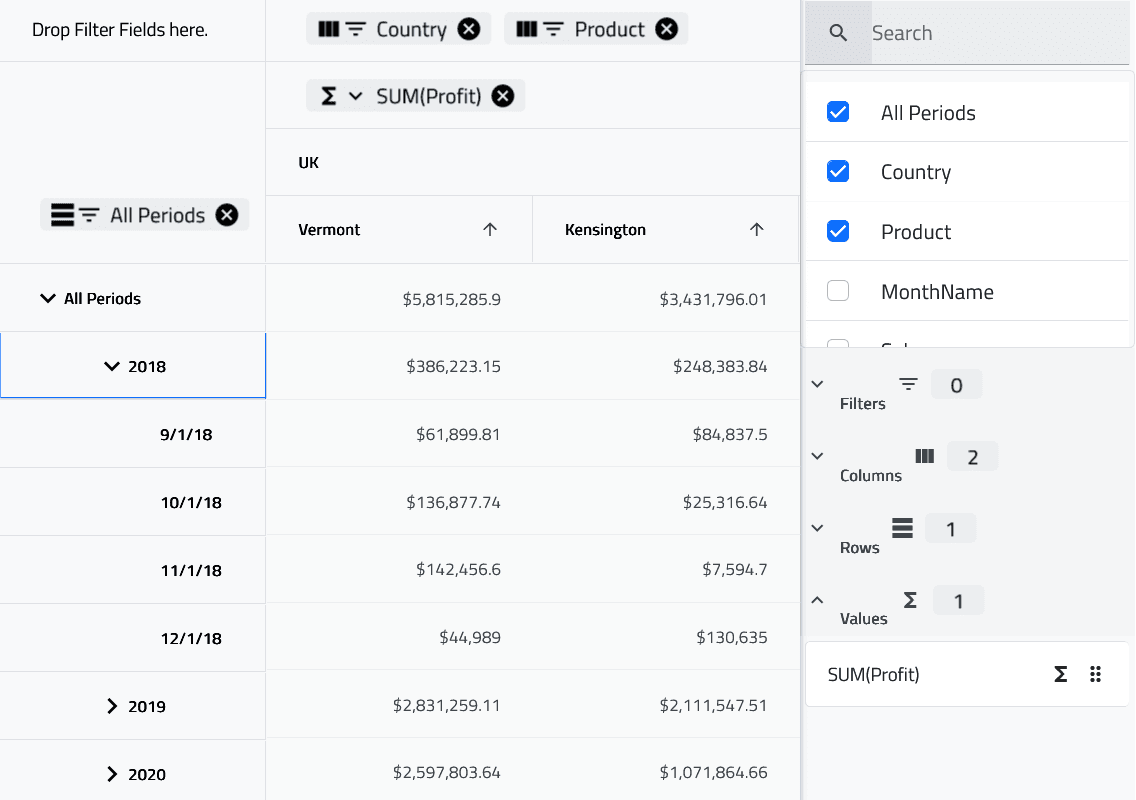
Multi-dimensional Data Presentation
Displays data in rows and columns representing distinct groups with aggregated values, enabling complex analysis from simple datasets.
Configurable Dimensions
Allows defining and enabling row, column, and filter dimensions using data fields with support for nested hierarchies and expandable child levels.
Value Aggregations
Supports multiple aggregation functions like sum, average, min, max, count, and allows custom aggregators specific to data types, modifiable at runtime.
Drag-and-Drop Layout Management
Enables users to reorder, move, and enable or disable dimensions and values interactively through UI chips, tailoring the pivot table to their needs.
Predefined Date Dimensions
Provides specialized date dimensions with hierarchical periods such as years, quarters, months, and full dates, which can be customized.
Auto-generation of Configuration
Automatically creates pivot configurations based on data source, distinguishing numeric, non-numeric, and date fields to simplify setup.
Filtering and Sorting
Supports filtering and sorting of summarized data, enhancing the end-user’s ability to analyze relevant information.
Customizable Pivot Keys
Offers control over internal keys used in aggregation and hierarchy building to avoid conflicts with data field names.
Integration with Pivot Data Selector
Works alongside a companion component that provides flexible runtime options for enabling and configuring pivot elements in the UI.
Developer Control and Extensibility
Exposes comprehensive API for configuring pivot layout, dimensions, aggregations, and behaviors suitable for integration in modern web applications.
Product Compatibility
Review the details below to ensure this product is supported within your environment.
Component Type
- JavaScript
JavaScript Platform
- Vanilla JavaScript
- Web Component
About Infragistics
Infragistics, founded in 1989 and headquartered in Cranbury, New Jersey, has established itself as a global force in UI/UX development, serving software professionals in over 100 countries. It is widely recognized for its comprehensive libraries and frameworks supporting web, desktop, and mobile platforms, including solutions tailored for .NET, Angular, React, and other leading technologies. With offices spanning Europe, Asia, and South America, Infragistics delivers components that enable efficient application development and rich user experiences. Its commitment to innovation and customer satisfaction positions it as a trusted partner for developers and organizations worldwide seeking quality and flexibility in their digital projects.

As official and authorized distributors since 1996, ComponentSource supplies you with legitimate licenses directly from Infragistics.