Lattice Grid
Build data-driven applications with interactive grids, analytics, and scheduling components.
- Display, edit, group, and analyze data through interactive grid components.
- Connect dashboards, charts, and operational views to shared application data.
- Create scheduling interfaces and validated forms for managing application records.

Prices from:
| Available individually | Our Price |
|---|---|
| Lattice Grid | Loading |
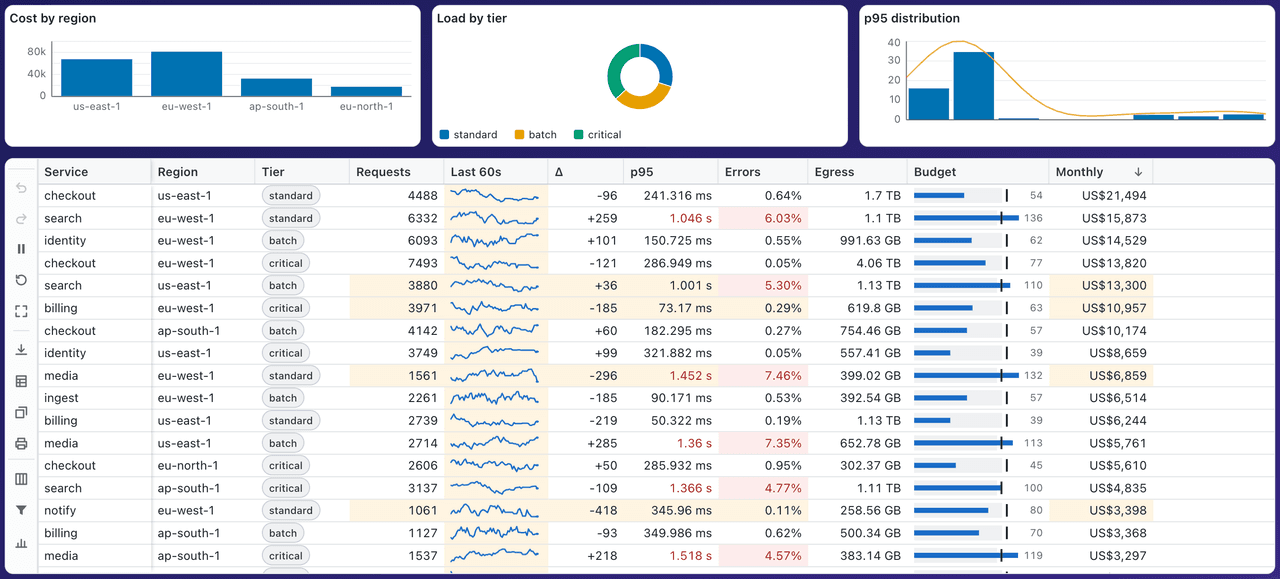
Interactive Data Grids
Present structured data with sorting, column filters, grouping, totals, and pivoting. Row and column virtualization supports navigation through large datasets, while tree structures and nested detail grids let users explore hierarchical records and the information associated with individual rows.
Editing and Validation
Let users update cells or complete rows, extend values with a fill handle, paste spreadsheet ranges, and apply bulk changes. Column validation checks entries before accepting them, while undo and redo support reversing edits, fills, and paste operations.
Derived Grids and Aggregations
Create grids whose contents are calculated from another grid through filtering, aggregation, pivoting, and joins. Chain derived grids to build successive views of the data, with results recalculated as filters change in the source grid.
Integrated Statistical Analysis
Calculate medians, percentiles, deviations, and column profiles from the data available to the grid. Explore correlations and distributions, with statistics responding to filters. For windowed remote sources, calculations describe loaded rows unless aggregation runs against the complete dataset through a supported connection.
Data Explanations and Clustering
Break totals into ranked contributors and examine which factors drive changes between data states. Assign rows to clusters that users can group or visualize, with segments recalculated as filtering changes the data under analysis.
Connected Dashboards and Charts
Combine charts, maps, grids, and key performance indicator (KPI) tiles in embedded dashboards. Visualizations follow the grid's filtered rows. The Designer lets users create and rearrange dashboard content, while saved layout definitions allow applications to restore their configurations.
Live Data Routing
Connect grids to in-memory collections, paged servers, remote sources, or streaming updates. The Data Router distributes records from a shared live feed to relevant views, allowing grids, charts, and boards to receive the data each view needs.
Planning and Scheduling Views
Build Gantt views with task dependencies, critical paths, and resource load information. Use Kanban boards to update records by moving cards, calendars to reschedule dated entries, and scheduler views to allocate people or equipment and identify over-allocation.
Forms and Record Management
Arrange forms using fieldsets, rows, and columns, with controls for text, numbers, choices, dates, and rich text. Apply validation and conditional field rules, bind forms to records, and combine record details with editable grids in a coordinated save workflow.
Typed Values and Formatting
Define column types that control parsing, sorting, formatting, and editing. Handle values such as currencies, dates, durations, measurements, and addresses according to their underlying data. Unit-aware fields convert entered measurements, while display formatting keeps stored values suitable for calculations.
Product Compatibility
Review the details below to ensure this product is supported within your environment.
Component Type
- JavaScript
JavaScript Platform
- Angular
- React
- Svelte
- Vanilla JavaScript
- Vue.js
- Web Component
About Lattice Grid
Lattice Grid is a software brand from TOCLOCO Inc, based in Wilmington, Delaware, focused on data visualization and user interface components for business applications. Its technology originated within an enterprise platform before becoming commercially available. The brand brings together data grids, dashboards, scheduling interfaces, and forms to help developers present, analyze, and manage application data. Its development approach emphasizes framework independence, consistent APIs, and responsive interaction with large datasets. Support comes directly from the developers who build the software, giving customers access to technical guidance from the engineering team.

As official and authorized distributors since 2026, ComponentSource supplies you with legitimate licenses directly from Lattice Grid.