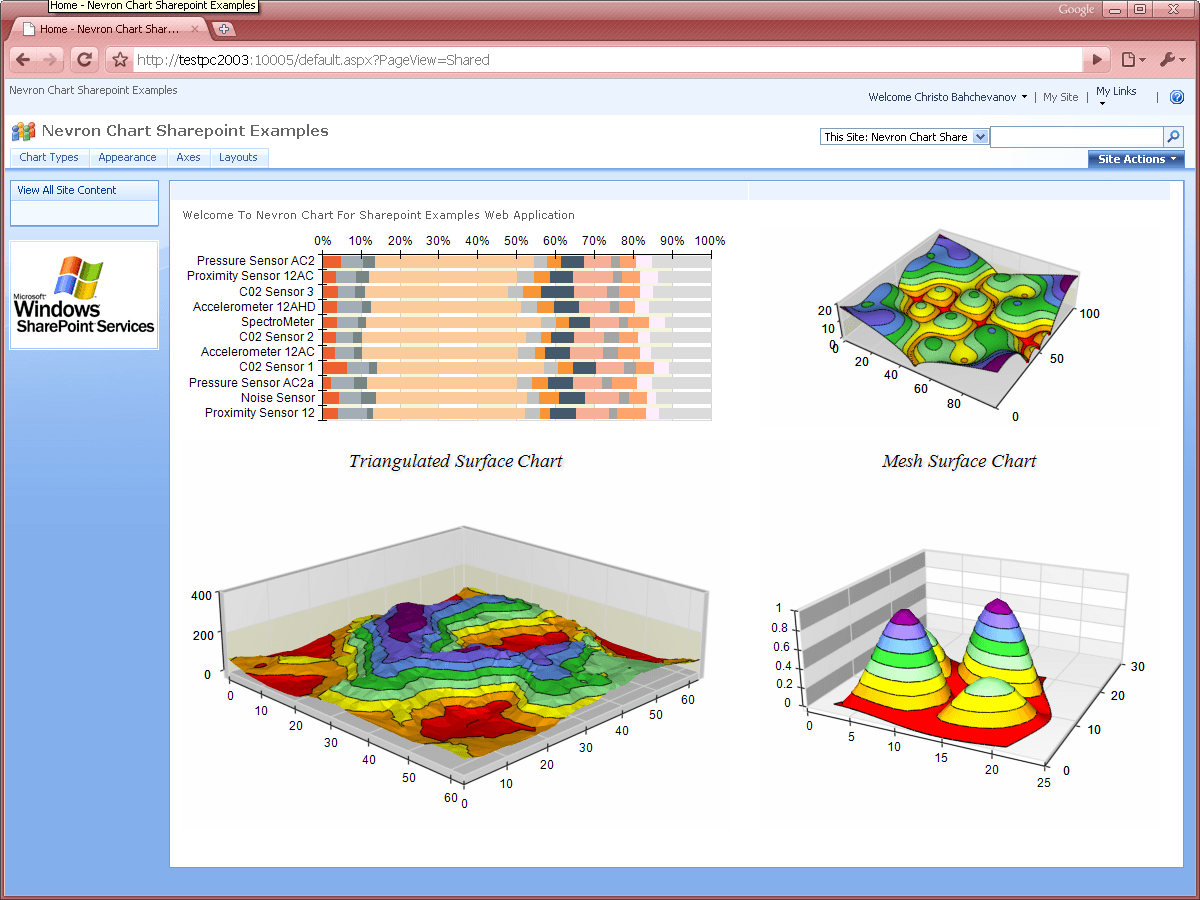
Nevron Vision for SharePoint
Advanced SharePoint data visualization with charts, gauges, and dashboards.
- Integrates rich data visualization components directly into SharePoint environments.
- Delivers interactive charts, gauges, and dashboards for business insights.
- Supports diverse data sources with flexible configuration and customization options.

Prices from:
Loading...
| Available individually | Our Price |
|---|---|
| Nevron Vision for SharePoint | Loading |
Nevron Vision for SharePoint is a web-based data visualization framework designed to extend SharePoint with advanced charting, gauge, and dashboard capabilities. It enables developers and administrators to present complex data through interactive visual elements, supporting integration with multiple data sources and enhancing reporting across SharePoint sites.
SharePoint Native Integration
Provides seamless integration with SharePoint, allowing visual components to be embedded directly into pages and web parts. It works within the SharePoint infrastructure to deliver consistent user experiences without requiring external applications or complex deployment processes.
Advanced Charting Capabilities
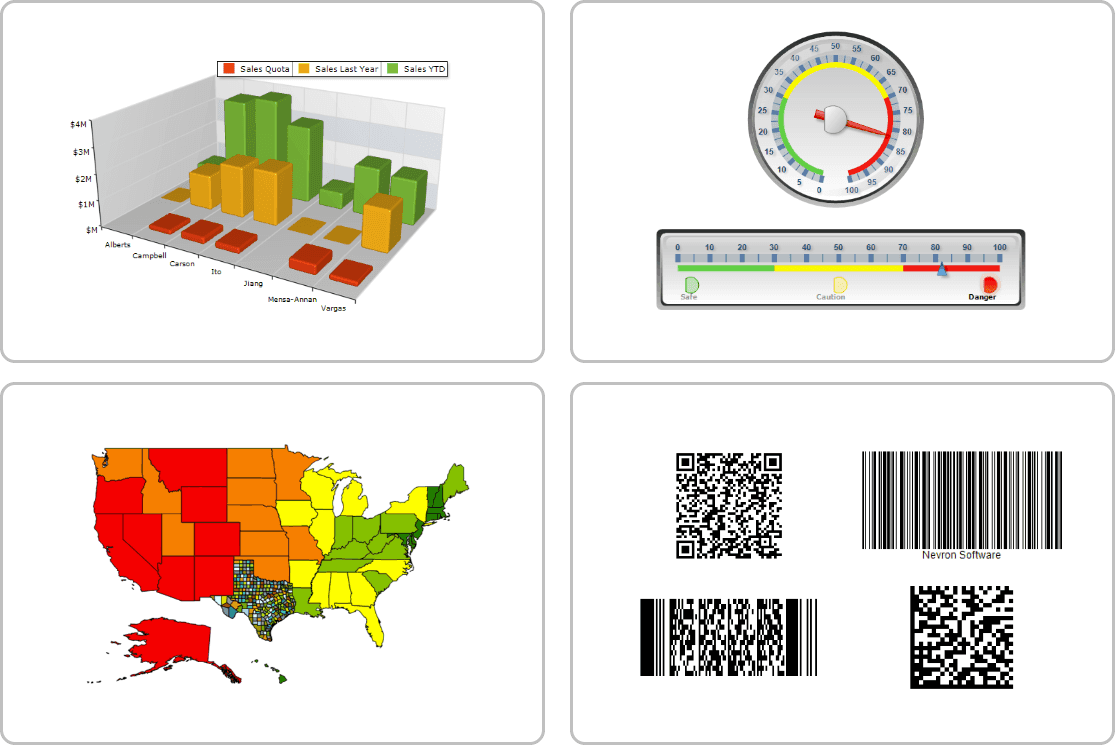
Includes a comprehensive charting engine supporting a wide range of chart types for data visualization. It enables developers to represent complex datasets clearly, with configurable axes, legends, and visual styles suited to analytical and reporting scenarios.
Interactive Dashboards
Enables the creation of interactive dashboards that combine multiple visual elements into a single view. Users can explore data dynamically through drill-down, tooltips, and real-time updates, improving insight accessibility across SharePoint portals.
Gauge And KPI Visualization
Offers gauge components for displaying key performance indicators and metrics in an intuitive format. It supports radial and linear gauges that help communicate thresholds, targets, and performance levels effectively within business dashboards.
Multiple Data Source Support
Connects to various data sources including SharePoint lists, SQL databases, and external providers. This flexibility allows developers to aggregate and visualize data from different systems within a unified SharePoint interface.
Customizable Visual Styles
Provides extensive customization options for visual appearance, including colors, gradients, and layout configurations. Developers can tailor visual elements to align with corporate branding or specific presentation requirements.
AJAX-Based Rendering
Uses AJAX technology to deliver responsive and smooth interactions without full page reloads. This enhances performance and usability when working with dynamic data visualizations in SharePoint environments.
No Client-Side Dependencies
Operates without requiring additional client-side installations or plugins. Visualizations are rendered directly in the browser, ensuring accessibility across different user environments and simplifying deployment.
Configurable Web Parts
Includes configurable web parts that allow administrators and developers to define visualization behavior and data binding through SharePoint interfaces. This reduces the need for custom coding while maintaining flexibility.
Product Compatibility
Review the details below to ensure this product is supported within your environment.
Component Type
- .NET
.NET Version
- .NET 4.8 or earlier
.NET Platform
- Web Part
What's Included

Barcode Tools

Chart Controls

Gauge Controls

Map Controls
About Nevron
Nevron, established in 1998 and headquartered in Sofia, Bulgaria, specializes in advanced data visualization and user interface components for software developers. Recognized for its rich set of charting, diagramming, and UI frameworks, Nevron serves a broad customer base spanning business intelligence, scientific, and enterprise application domains. Its components are engineered to integrate across platforms and development environments like .NET and web applications, offering extensive customization and performance. Developers choose Nevron for its mature technology and focus on detailed, interactive visualization, supporting complex data analysis and clear presentation in critical business systems.

As official and authorized distributors since 1999, ComponentSource supplies you with legitimate licenses directly from Nevron.