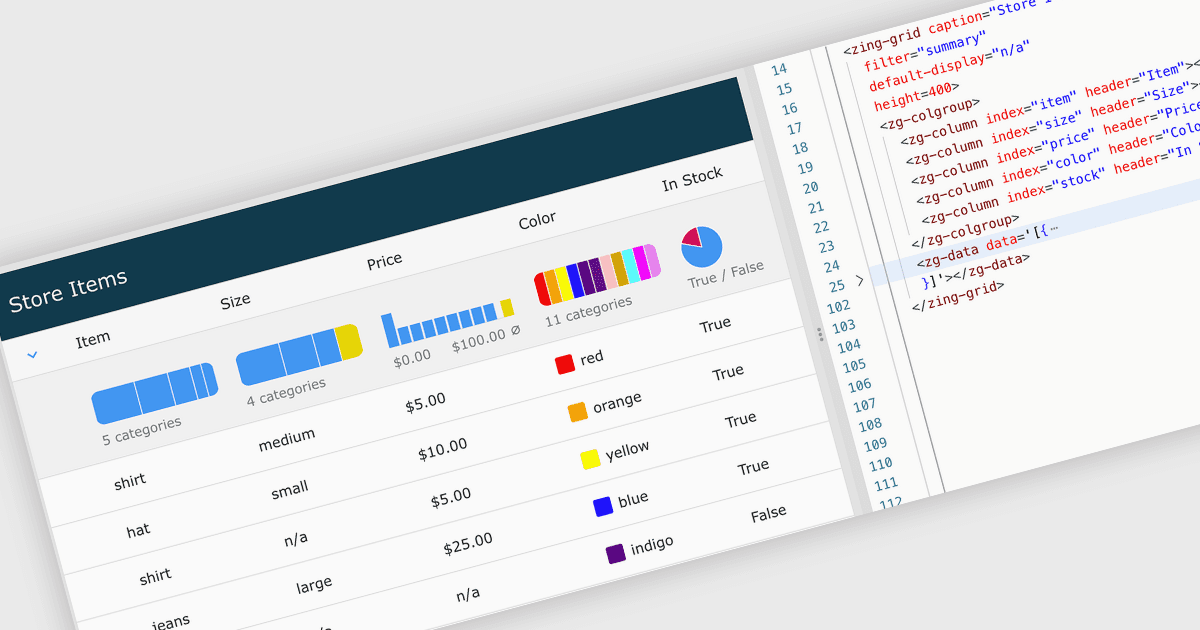
Filter Data with Interactive Summary Charts
ZingGrid 2.2.0 adds a filter summary chart that enables visual exploration and interactive filtering of grid data for faster analysis.
Create interactive and accessible data grids with ease.

Prices from:
| Available individually | Our Price |
|---|---|
| ZingGrid | Loading |
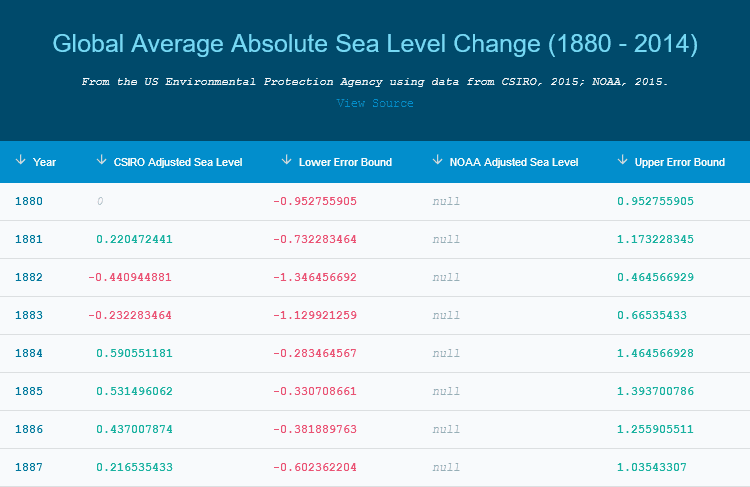
ZingGrid provides a native Web Component that simplifies embedding interactive HTML data tables with minimal markup. It integrates smoothly with popular frameworks such as React, Angular, Vue, and jQuery.
Supports aggregation functions like sum, average, min, max, and count across rows and columns. Enables integration of static, inline, remote, and paginated data sources with built-in performance optimizations.
Includes default inline cell editing, batch editing, modal editing, and static row controls. Custom editors can be registered and layouts adapted for enhanced data entry and management experiences.
Allows per-column and advanced filtering alongside global search functionality for efficient data querying and exploration within grids.
Features context menus, drag-and-drop column rearrangement, expandable content, drilldown rows, row grouping, multi-selection modes, sorting, paging options, and virtual scrolling to engage users with dynamic datasets.
Offers configurable column types, custom cell renderers, conditional formatting, gridlines, zebra striping, responsive layouts, buttons, captions, freeze panes, media embedding, and theming for tailored UI presentation.
Review the details below to ensure this product is supported within your environment.
ZingGrid 2.2.0 adds a filter summary chart that enables visual exploration and interactive filtering of grid data for faster analysis.
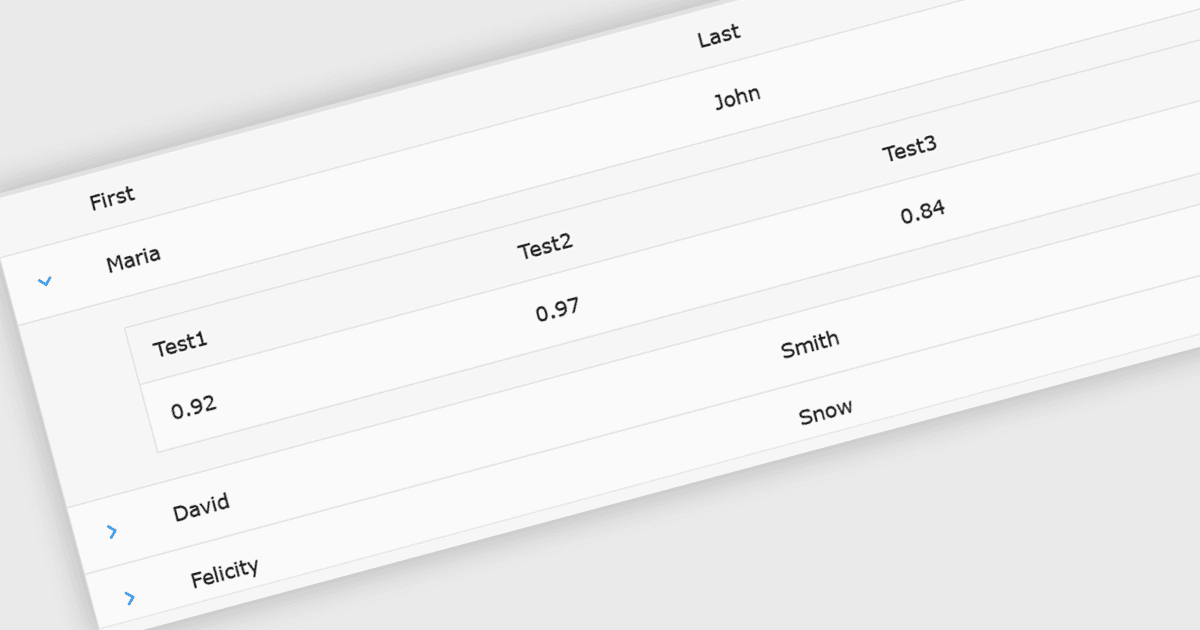
ZingGrid 2.0.0 allows JavaScript grid users to reveal additional data without cluttering the main grid view or losing context.
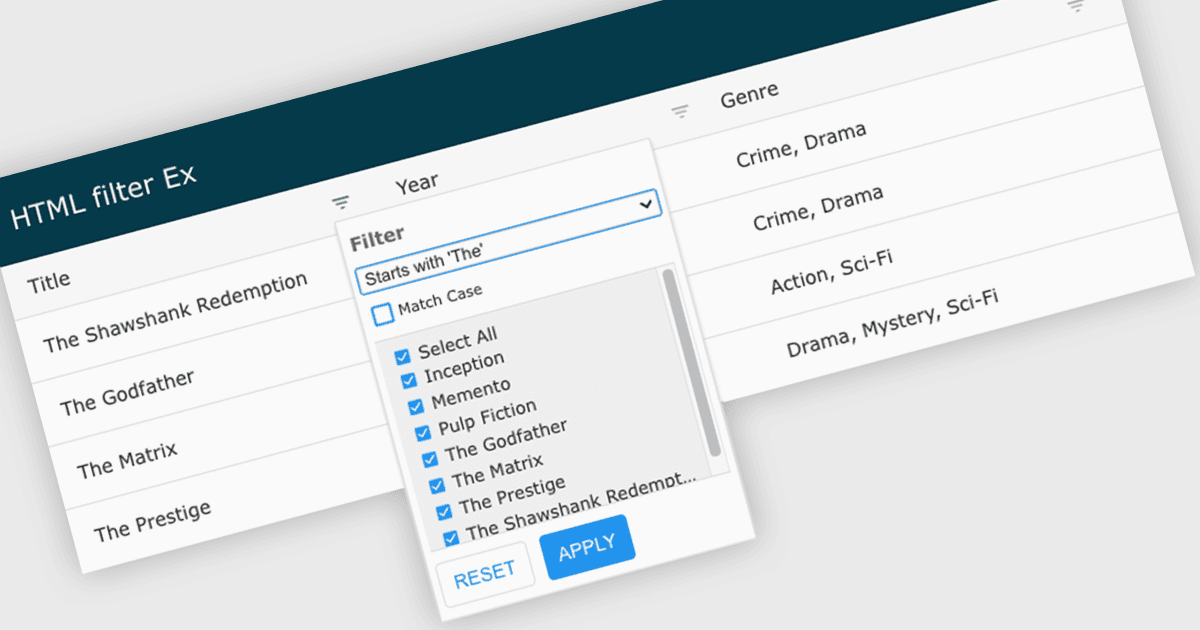
ZingGrid 1.7.0 empowers users to easily sift through data and find exactly what they are looking for, regardless of its complexity.
ZingGrid, launched by ZingSoft and headquartered in San Diego, California, is a JavaScript web component library created to deliver flexible and feature-rich interactive data grids for web applications. First introduced under the ZingChart, Inc. banner and guided by industry expert Thomas Powell, ZingGrid integrates with popular frameworks like React, Angular, and Vue. It enables developers to create highly customizable and accessible HTML tables with minimal setup. Designed to support a wide range of data visualization needs, ZingGrid excels in interactivity, customization, and compatibility across all major browsers and devices.

As official and authorized distributors since 2019, ComponentSource supplies you with legitimate licenses directly from ZingGrid.