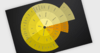
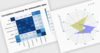
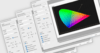
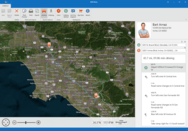
맵 컬렉션 - Highcharts Maps(하이차트 맵)에는 하이차트 맵에 사용하도록 최적화된 맵 컬렉션이 포함되어 있습니다. 일반적인 맵의 경우 적합한 SVG 또는 GeoJSON 맵을 찾거나 그리는 데 문제가 발생합니다. 대신 국가, 지역 및 기타 행정기관 수준의 수백 개의 사전 생성된 맵 중에서 선택할 수 있습니다.
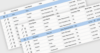
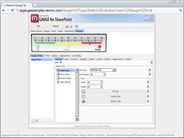
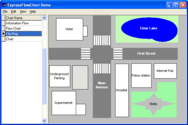
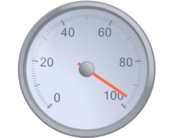
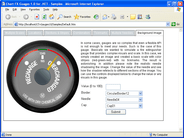
Codejock Chart Pro - 차트 종류는 바, 점, 선, 원형, 레이더, 북극, 지역, 금융, 간트, 퍼널, 피라미드, 그래핑 및 분석 (Bar, Point, Line, Pie, Radar, Polar, Area, Financial, Gantt, Funnel, Pyramid, Graphing 및 Analysis)을 포함합니다. 차트는 완벽하게 사용자 정의가 가능하여, 사용자는 거의 모든 차트 스타일을 만들 수 있습니다.
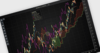
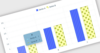
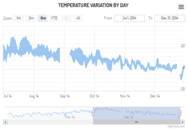
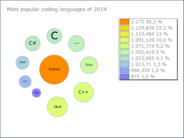
Create animated and interactive charts with thousands of data records.
Performance - ZingChart offers canvas and SVG rendering options depending on your speed needs. You can render 100,000 data points in under a second and because the entire chart is a JSON object the state of the chart is 100% savable across platforms.