Fornecedor oficial
Como distribuidores oficiais e autorizados, nós fornecemos licenças legítimas diretamente de mais de 200 editores de software.
Ver todas as nossas marcas.

Descrição: of targets. Vizuly Halo uses several different data visualization techniques to represent transactional ... in the middle of the chart. The length of each source arc is determined by a data bound variable you specify ... and the size and cluster group of each target circle can also be determined by data bound variables. The data ... Leia mais Mostrar mais resultados deste produto
Descrição: de destinos. Vizuly Halo uses several different data visualization techniques to represent transactional ... middle of the chart. The length of each source arc is determined by a data bound variable you specify and ... the size and cluster group of each target circle can also be determined by data bound variables. The ... Leia mais
Licenciamento: Vizuly Halo Licensing Leia mais
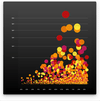
Descrição: Add Scatter Plot charts to your JavaScript apps. Vizuly Scatter Plot shows 3 dimensions of data ... can be colored and styled dynamically based on your data. Features Supports Dynamic Scales for Radius ... event support Customizable Data Tips Documentation Framework Adapters React Adapters Angular Adapters ... Leia mais Mostrar mais resultados deste produto
Descrição: dimensions of data at once by plotting values along both the x and y axis as well as the radius of the plot ... itself. Each plot can be colored and styled dynamically based on your data. Features Supports Dynamic ... properties and interactive event support Customizable Data Tips Documentation Framework Adapters React ... Leia mais
Capturas de tela: 0 ... Leia mais
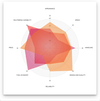
Descrição: datum along multiple radial axis. Each plot represents 3 or more data points along shared axis lines. ... This chart supports highlighting of both individual data points and the group as a whole. Features Supports ... dynamic styles Dozens of adjustable properties and interactive event support Customizable Data Tips ... Leia mais Mostrar mais resultados deste produto
Descrição: dimensions of one datum along multiple radial axis. Each plot represents 3 or more data points along shared ... axis lines. This chart supports highlighting of both individual data points and the group as a whole. ... Data Tips Documentation Framework Adapters React Adapters Angular Adapters Vue.js Adapters ... Leia mais
Capturas de tela: 0 ... Leia mais

Descrição: Represent cartesian x/y data within a radial plot. Vizuly Radial Bar is designed to represent ... cartesian x/y data within a radial plot. It supports both clustered and stacked radial bars Use ... Dozens of adjustable properties and interactive event support Customizable Data Tips Documentation ... Leia mais Mostrar mais resultados deste produto
Descrição: cartesian x/y data within a radial plot. It supports both clustered and stacked radial bars Use the ... Dozens of adjustable properties and interactive event support Customizable Data Tips Documentation ... Leia mais
Licenciamento: Vizuly Radial Bar Licensing Leia mais
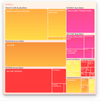
Descrição: Add Tree Map charts to your JavaScript apps. Vizuly Tree Map visualizes hierarchical data ... in nested rectangular plots where the area of each rectangle is bound to a data property you can set. ... event support Customizable Data Tips Documentation Framework Adapters React Adapters Angular Adapters ... Leia mais Mostrar mais resultados deste produto
Descrição: hierarchical data in nested rectangular plots where the area of each rectangle is bound to a data property you ... Dozens of adjustable properties and interactive event support Customizable Data Tips Documentation ... Leia mais
Capturas de tela: 0 ... Leia mais
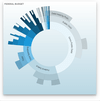
Descrição: hierarchical data in a radial plot. It supports drill down and drill up capabilities by allowing the user ... and interactive event support Customizable Data Tips Documentation Framework Adapters React Adapters Angular ... Leia mais Mostrar mais resultados deste produto
Descrição: represent hierarchical data in a radial plot. It supports drill down and drill up capabilities by allowing ... adjustable properties and interactive event support Customizable Data Tips Documentation Framework Adapters ... Leia mais
Capturas de tela: 0 ... Leia mais
Descrição: usually circles, each representing a set. Using data bound dynamic styles you can declare different colors ... properties and interactive event support Customizable Data Tips Documentation Framework Adapters React ... Leia mais Mostrar mais resultados deste produto
Descrição: overlapping closed curves, usually circles, each representing a set. Using data bound dynamic styles you can ... dynamic styles Adjustable properties and interactive event support Customizable Data Tips Documentation ... Leia mais
Capturas de tela: 0 ... Leia mais
Descrição: Tree nodes and branches can be dynamically sized and styled based on data bound properties that you ... support Customizable Data Tips Documentation Framework Adapters React Adapters Angular Adapters Vue.js ... Leia mais Mostrar mais resultados deste produto
Descrição: Tree nodes and branches can be dynamically sized and styled based on data bound properties that you ... support Customizable Data Tips Documentation Framework Adapters React Adapters Angular Adapters Vue.js ... Leia mais
Licenciamento: Vizuly Weighted Tree Licensing Leia mais
Descrição: a dozen dynamic styles Dozens of adjustable properties and interactive event support Customizable Data ... Leia mais Mostrar mais resultados deste produto
Descrição: a dozen dynamic styles Dozens of adjustable properties and interactive event support Customizable Data ... Leia mais
Capturas de tela: 0 ... Leia mais

Descrição: styles Easily Modifiable Built in customizable data tips All Source Code- Fully Commented Vizuly Open ... Leia mais Mostrar mais resultados deste produto
Descrição: Layouts Over 2 dozen dynamic styles Easily Modifiable Built in customizable data tips All Source Code- ... Leia mais
Capturas de tela: 0 ... Leia mais