
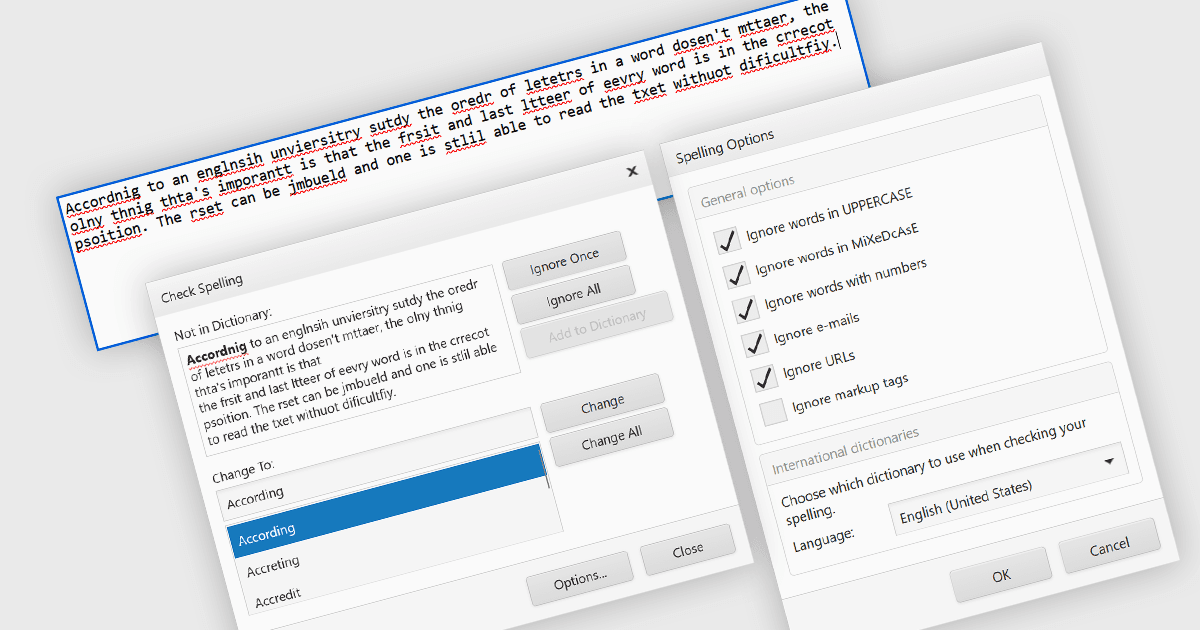
Check Spelling in ASP.NET Applications
Help users identify spelling errors and review correction suggestions in text fields and editors before submitting forms or saving web content.
Design rich, interactive application interfaces and data visualizations using comprehensive component collections.
UI & Visualization Suites bring together a broad set of user interface components and visual elements for building modern software applications. They typically include controls for layouts, navigation, data display, charts, dashboards, forms, and interactive visuals, along with styling and theming options. Suites may be delivered as a single multifunction product or as bundled products that work together. They are used across web, desktop, and mobile projects to create consistent, responsive, and visually clear interfaces. By offering reusable components and integrated visualization features, these suites reduce development effort, support design consistency, and help teams deliver polished user experiences.

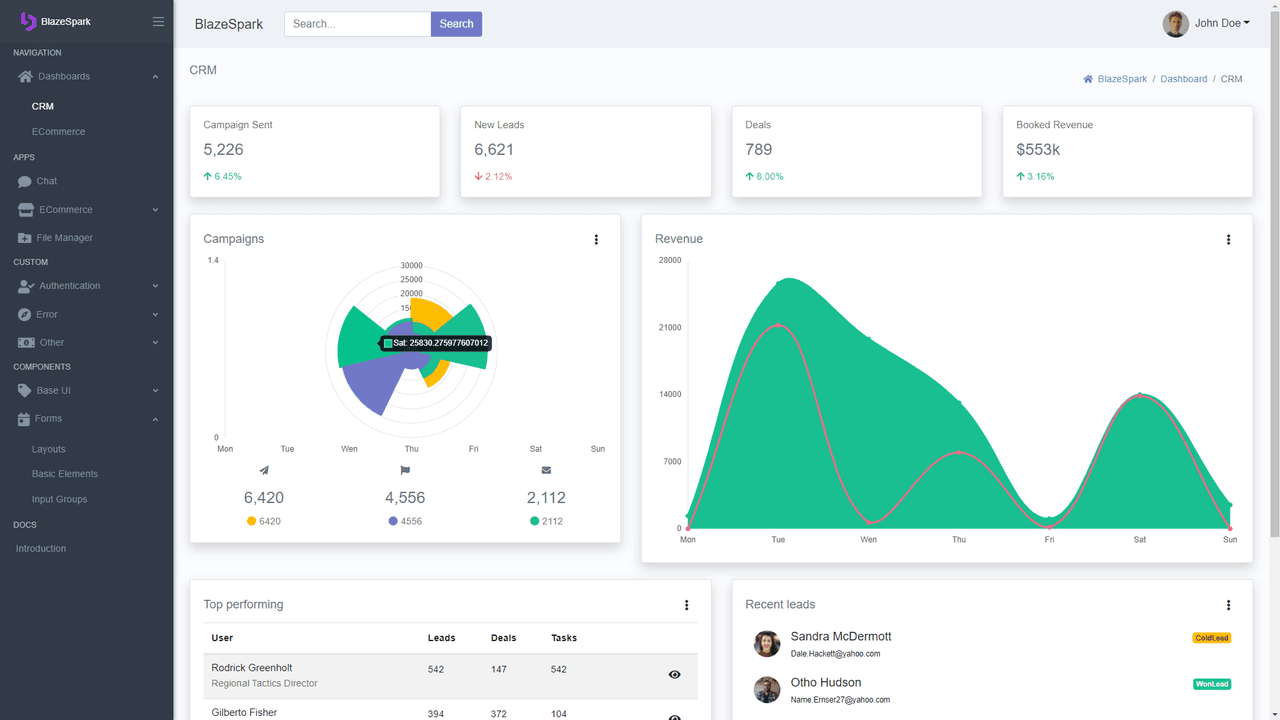
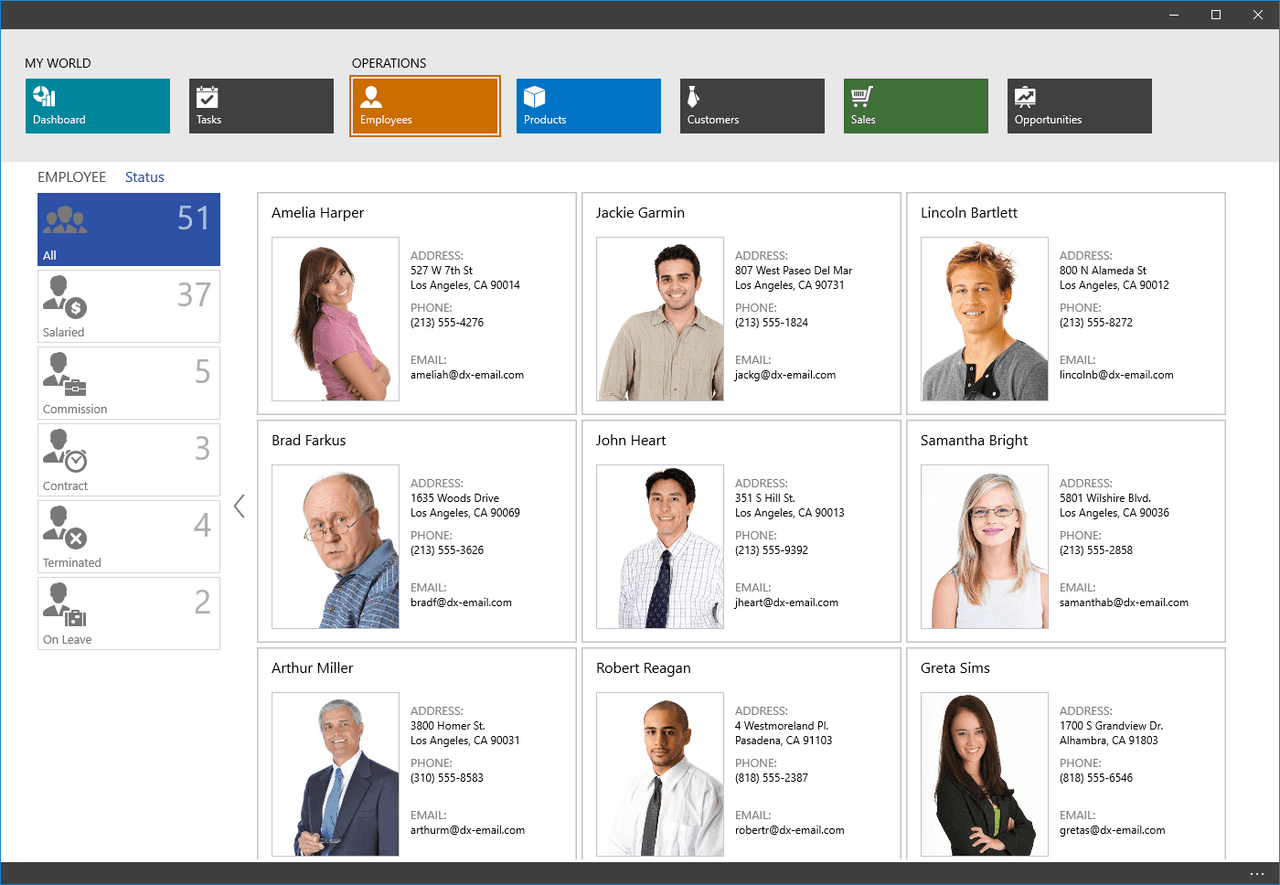
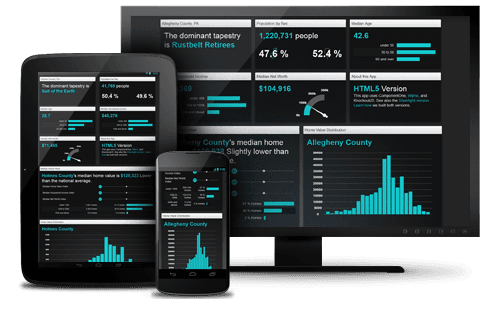
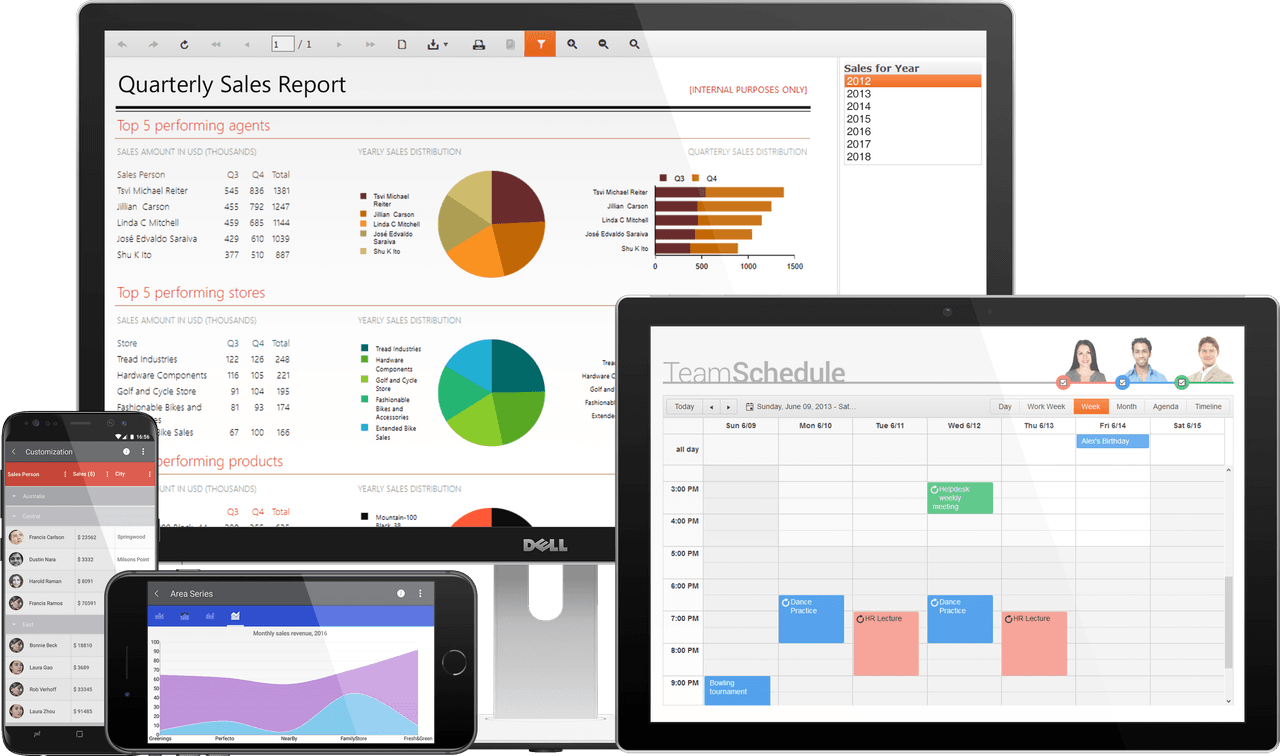
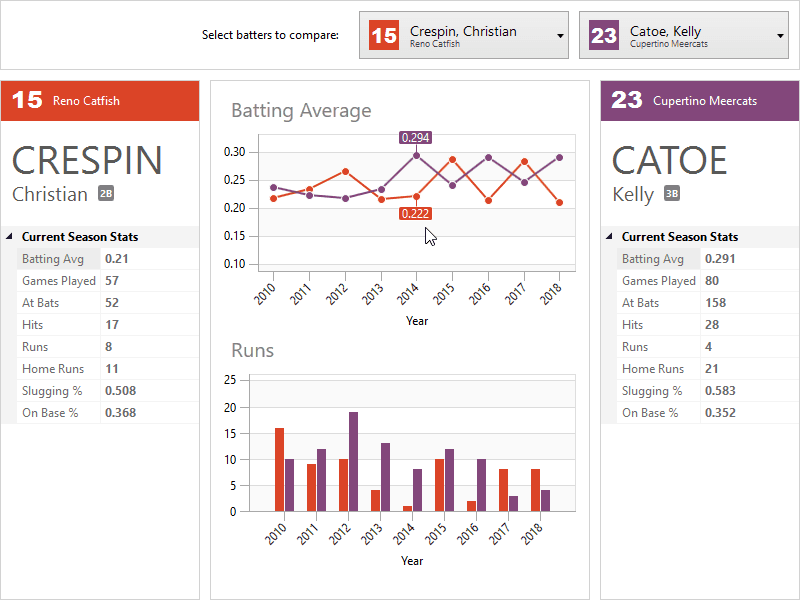
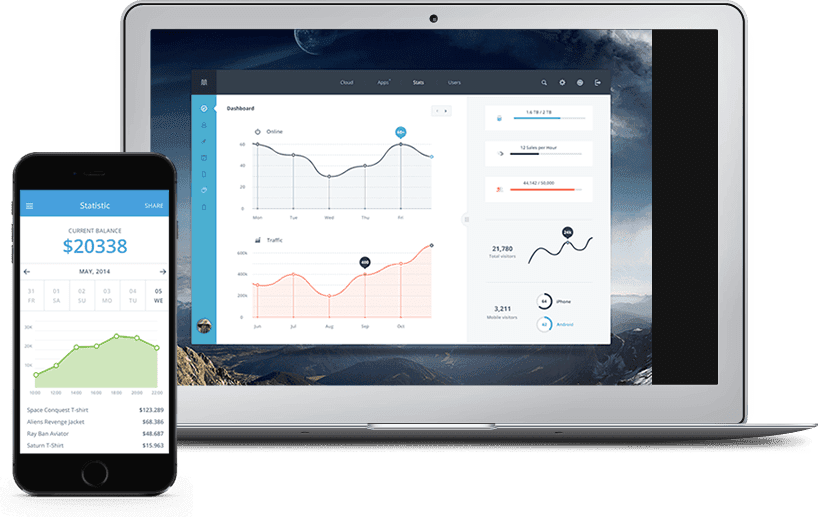
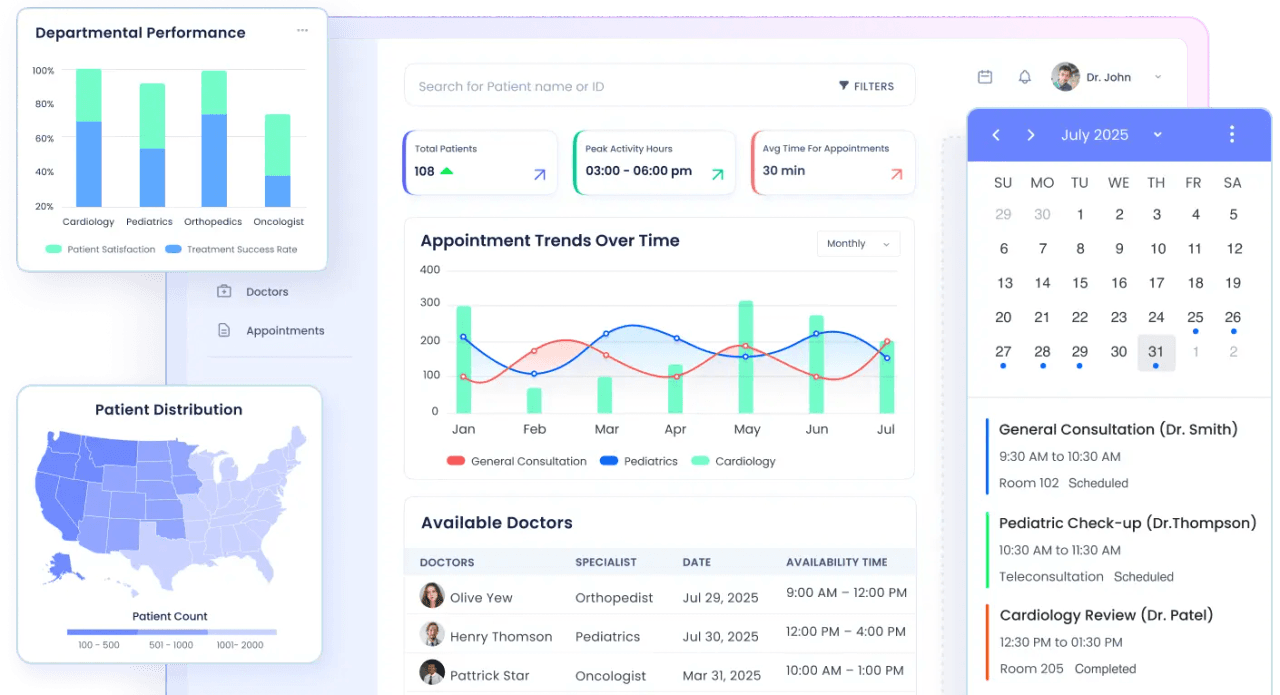
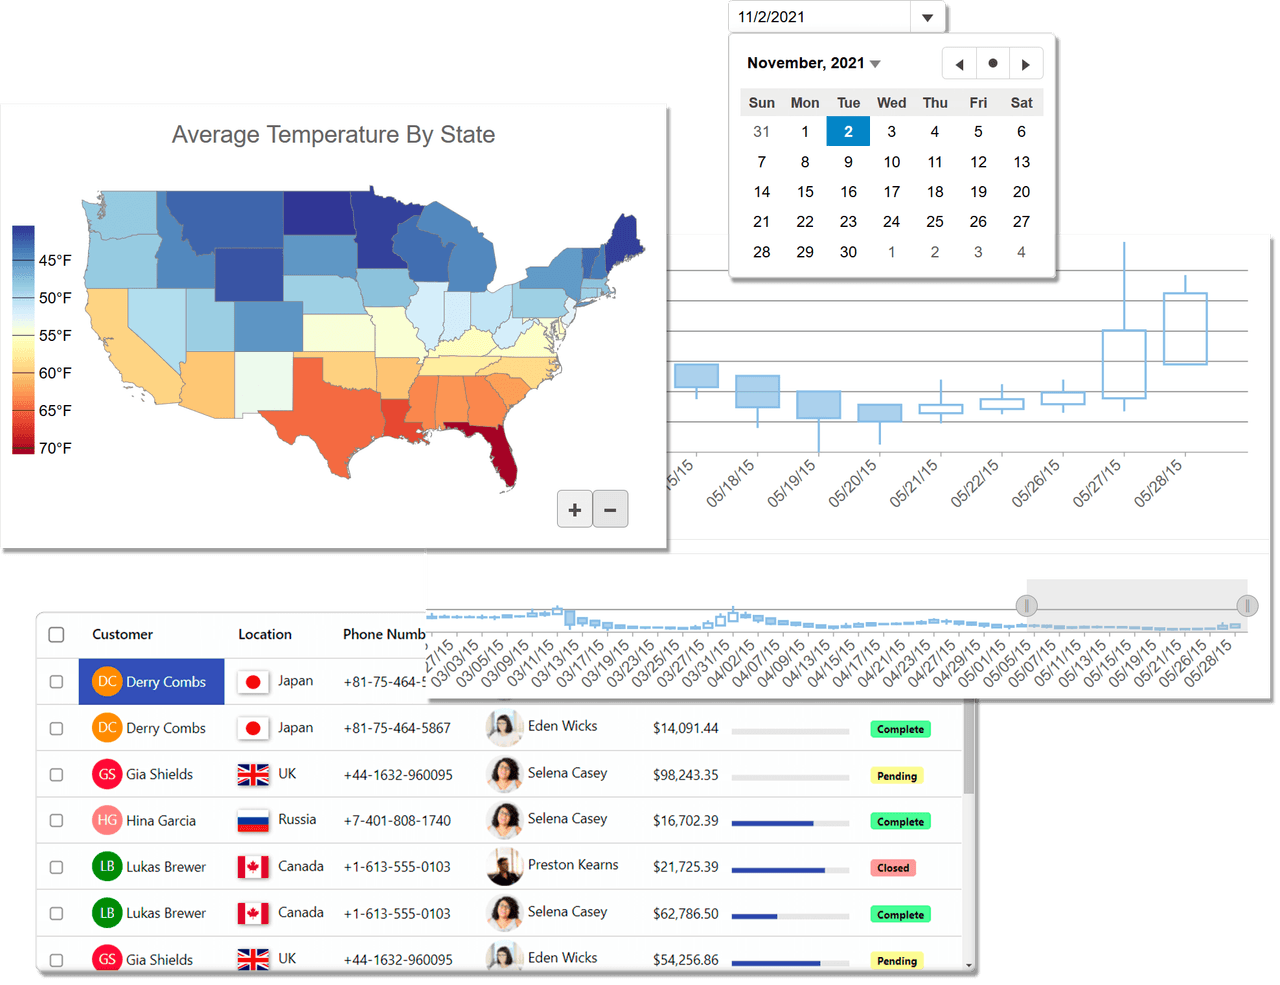

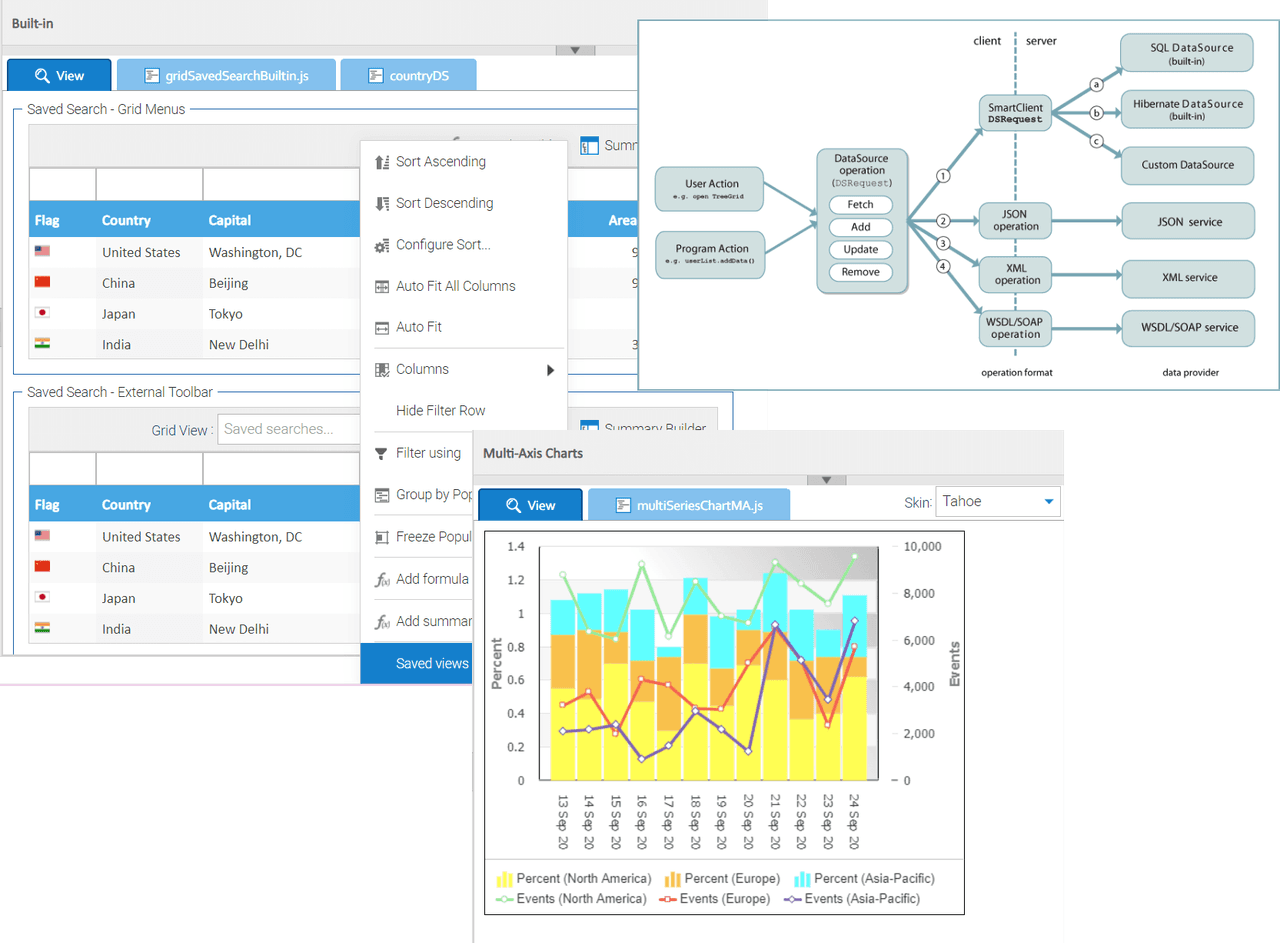
Browse publishers offering UI & Visualization Suites solutions across a wide range of platforms and project requirements.


















Browse UI & Visualization Suites by platform to find options that fit your project requirements.



























































Help users identify spelling errors and review correction suggestions in text fields and editors before submitting forms or saving web content.
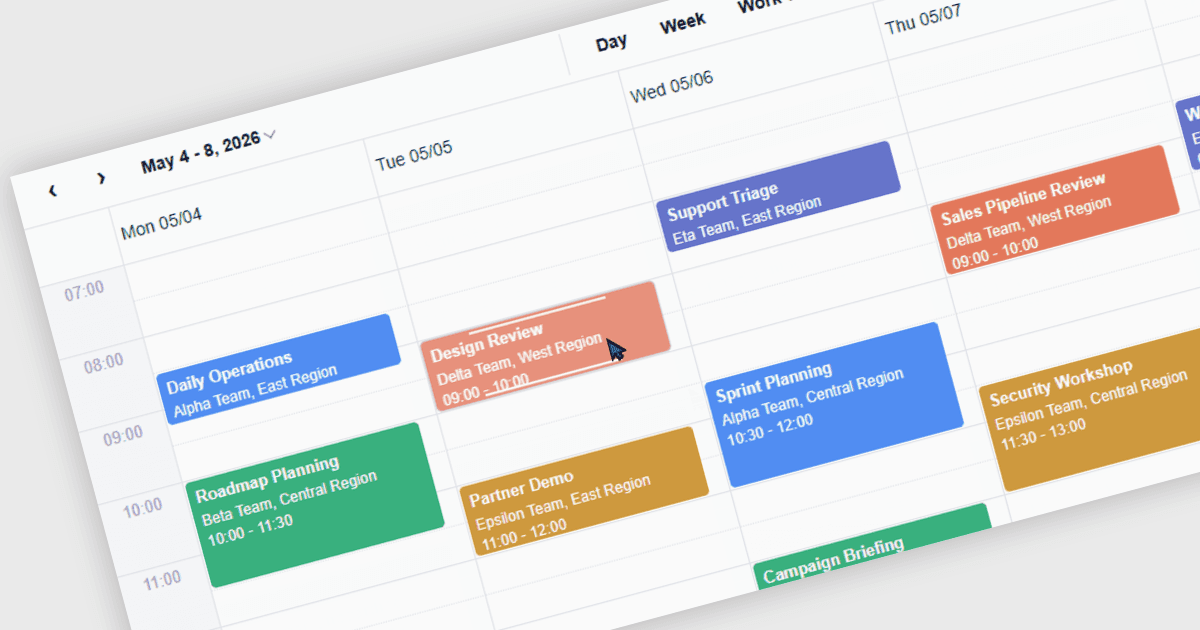
Wijmo 2026 v2 adds FlexScheduler, helping developers build calendars and resource schedules with event editing, conflict detection, and time zone support.
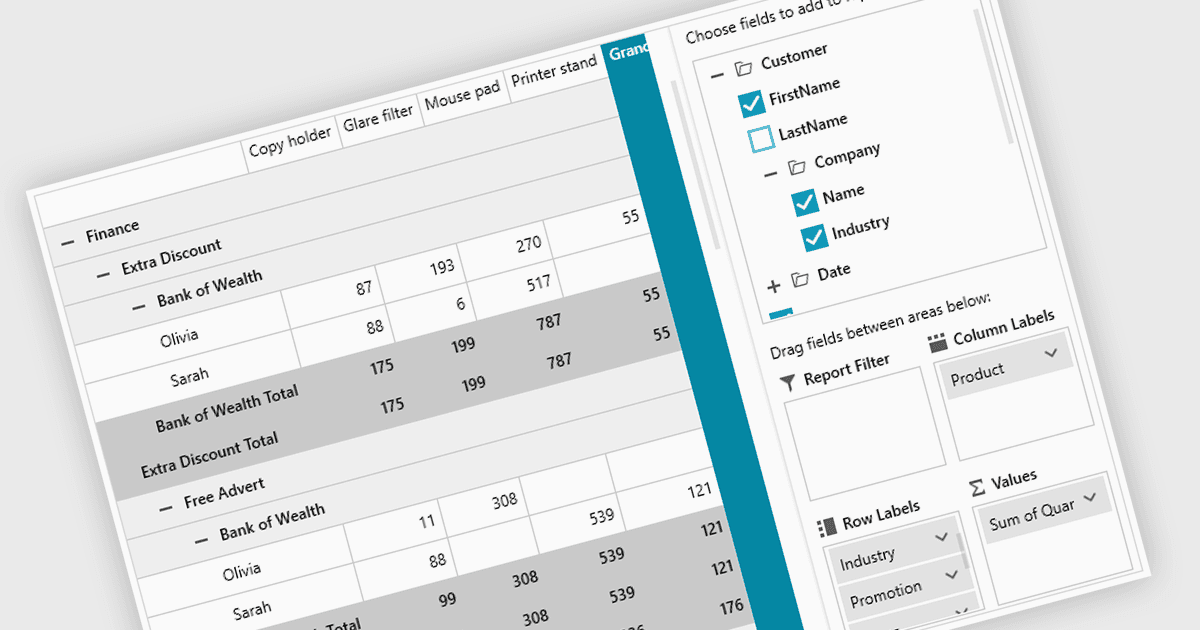
.NET WPF Pivot Grid controls enable developers to present, group, filter and summarize multidimensional data for interactive analysis.
Our product experts can help you narrow down the category and identify options that fit your platform, requirements and budget.