jQWidgets React Chart
Create interactive React charts with flexible series and axes configuration.
- Supports line, bar, pie, area, column, and spline charts.
- Enables data binding with structured data field mapping options.
- Built as a React component with events and visual customization.

Prices from:
| Available in | |
|---|---|
| jQWidgets | Loading |
Support for Multiple Chart Types
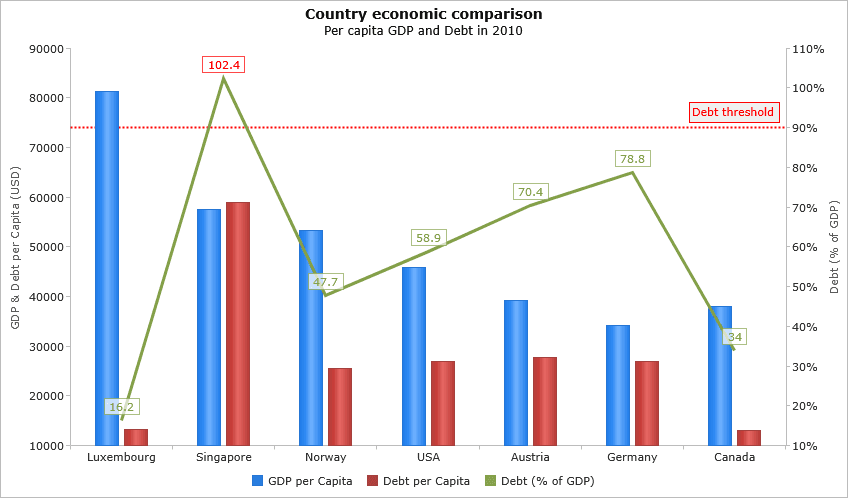
The component supports a range of chart types including line, spline, area, stacked area, bar, stacked bar, column, stacked column, pie, donut, and scatter charts. These can be configured within series groups to represent different data relationships and analytical scenarios.
Series Groups
The component organizes data into series groups, allowing multiple related series to be displayed within a single chart. Each group can define its own chart type and configuration, enabling flexible representation of complex datasets.
Category and Value Axes Configuration
The component allows developers to define both category and value axes, including labels, scaling, and orientation.
Data Field Mapping and Binding
The chart uses data field mapping to connect data source fields to visual elements. This enables structured binding of datasets, ensuring that values, categories, and series are correctly represented within the chart.
Customizable Rendering and Layout
Developers can configure layout, dimensions, and rendering behavior through component properties. This allows charts to fit within different interface designs and adapt to varying layout requirements in React applications.
Interactive Features with Tooltips
The chart includes interactive elements such as tooltips that display additional information for data points.
Event Handling for User Interaction
The component exposes events related to chart interaction, allowing developers to respond to actions such as selecting or hovering over data points.
Animation Support for Visual Transitions
The chart supports animation settings that control how data is rendered and updated visually. This allows developers to define transitions that reflect changes in data or chart configuration.
Styling and Visual Customization
Developers can adjust colors, labels, and other visual elements through configuration properties. This ensures that charts align with application design and provide clear, readable data presentation.
Product Compatibility
Review the details below to ensure this product is supported within your environment.
Component Type
- JavaScript
JavaScript Platform
- React
About jQWidgets
jQWidgets Ltd., founded in 2011 and based in Sofia, Bulgaria, develops user interface components for web and mobile application development. Its products include jQWidgets, a JavaScript and HTML5 UI framework with widgets, themes, data adapters, validation, drag-and-drop features, accessibility support, internationalization, and MVVM capabilities. The company supports developers working with Angular, React, Vue, JavaScript, TypeScript, and jQuery. Its components help teams create responsive, touch-enabled applications for desktop, tablet, and mobile devices.

As official and authorized distributors since 2013, ComponentSource supplies you with legitimate licenses directly from jQWidgets.